investment viewpoints
Climate bonds: assessing avoided emissions


Assessing the carbon profile of projects funded by our Global Climate Bond strategy is crucial to determining the climate mitigation potential of our investments. As carbon is the ‘currency’ of climate change, our independent analysis is aimed at mitigating the lack of harmonisation and different degrees of sophistication characterising issuers’ reporting on avoided greenhouse gas (GHG) emissions.
The Carbon Yield® methodology1 quantifies one of the environmental impacts of the strategy in terms of greenhouse gas (GHG) emissions avoided through financed activities per USD invested. The methodology estimates the difference between:
- The carbon footprint of the funded projects
- The GHG emissions that would have occurred under a reasonable baseline scenario if those projects had not been implemented
Figure 1. The Carbon Yield® method to quantify avoided GHG emissions
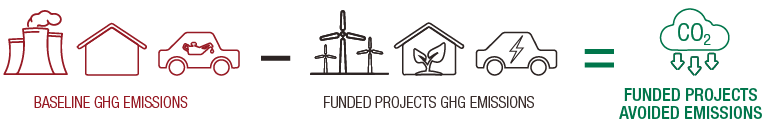
Source: AIM, LOIM. For illustrative purposes only.
The difference represents the emissions that are potentially avoided by a given project2. Individual bond avoided emissions figures are aggregated to determine the portfolio–weighted GHG emissions avoided per unit of capital invested, ie the Carbon Yield®. The results of the funded projects’ GHG analysis in 2020 are summarised in figure 2. Through its 2020 holdings, the strategy avoided 126,622tCO2e due to the projects funded. This equates to a significant 70% GHG emissions savings.
Figure 2. Avoided emissions: 70% GHG emissions savings
|
CARBON YIELD |
⇒
⇒ |
Equivalent to the emissions resulting from the average annual electricity consumption of 300 households in the United Kingdom.
Equivalent to the emissions resulting from over 1 million km driven by an average passenger vehicle in the United States.
|
|
|
This equates to 70% GHG emissions savings. This represents the percentage difference between the footprint of the average baseline project and the footprint of the average funded project. Calculations are based on project-level scope 1 & 2 emissions. |
126,622tCO2 e avoided per year due to the projects funded by the bonds held. Calculations are based on the International Energy Agency’s (IEA’s) Stated Policies Scenario (STEPs). Calculations are based on project-level scope 1 & 2 emissions. |
Scope 1 & 2 |
emissions 53,631 tCO2e Estimated to arise from the operations of the funded projects. |
|
Scope 1, 2 & 3 |
emissions 69,710 tCO2e Estimated to arise when the construction and material use of the funded projects is also accounted for. |
||


Source: AIM, LOIM. For illustrative purposes only.
Renewables: setting dynamic baselines
This year’s Impact Report differs from previous years in setting a dynamic baseline for avoided emissions in the renewables sector. While the change may result in lower estimated GHG emissions savings, it is the result of a more robust and conservative baseline-setting exercise that reflects our commitment to reporting impact using the best practice available.
In previous years, AIM conducted the analysis by assuming a static, business-as-usual scenario that implied the use of a ‘status quo’ baseline over the lifetime of a given funded project. For renewable energy projects in 2020, the decision was made to replace business-as-usual baselines with dynamic baselines that take into consideration future changes in the composition of electricity grids across the globe, and consequent changes in their emission intensity, under rigorous scenarios.
For a renewable energy power-generating asset, avoided emissions are represented by the GHG emissions savings that are potentially enabled by the substitution of grid electricity (baseline scenario) with electricity from renewable sources generated through the funded project.
The generation mix of electricity grids across the globe has changed considerably in recent years. Figure 3 shows the recent development of grid emission factors in the United States and the European Union as well as future estimated emission factors derived from IEA projections under different scenarios as defined in the 2020 World Energy Outlook (WEO)3. Both grids, to different extents, have undergone substantial decarbonisation paths. This global trend is then projected to be reinforced by the increased ambition of climate policies, technology progress and market development that will lead to a larger uptake of renewables and lesser reliance on fossil fuels.
Figure 3. Carbon intensity of the electricity grid in the US and EU
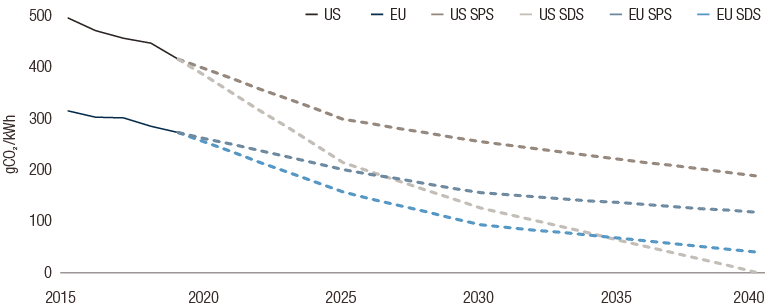
Source: LOIM, AIM elaboration based on EIA and EEA (historical data) and IEA 2020 WEO (future projections). For illustrative purposes only.4
In light of the above, AIM deemed that static, business-as-usual baselines—i.e. point-in-time grid emission factors—should be replaced with emission factors reflecting the expected evolution of the energy mix during a given project’s lifetime.
For 2020, the dynamic baselines were based on the IEA’s Stated Policies Scenario (STEPS)5. The STEPS scenario "reflects the impact of existing policy frameworks and today’s announced policy intentions". In addition, the same analysis was undertaken using the IEA’s Sustainable Development Scenario (SDS)6 as a baseline, reflecting the development of a Paris-aligned electricity mix. Both baselines were normalised figures of the expected grid composition during a project’s lifetime.
Overall, this methodological development for calculating the avoided emissions of renewable energy projects is in line with our commitment to best-practice impact reporting, even when upgraded methodologies may, at first glance, shed an unfavourable light on the impact achieved by our investments, such as their potential for climate-change mitigation.
In future, we will consider extending this scenario-based approach to other green project categories.
Please click here to read the full impact report.
Sources
Informazioni importanti.
RISERVATO AGLI INVESTITORI PROFESSIONISTI
Il presente documento è stato pubblicato da Lombard Odier Funds (Europe) S.A., una società per azioni di diritto lussemburghese avente sede legale a 291, route d’Arlon, 1150 Lussemburgo, autorizzata e regolamentata dalla CSSF quale Società di gestione ai sensi della direttiva europea 2009/65/CE e successive modifiche e della direttiva europea 2011/61/UE sui gestori di fondi di investimento alternativi (direttiva AIFM). Scopo della Società di gestione è la creazione, promozione, amministrazione, gestione e il marketing di OICVM lussemburghesi ed esteri, fondi d’investimento alternativi ("AIF") e altri fondi regolamentati, strumenti di investimento collettivo e altri strumenti di investimento, nonché l’offerta di servizi di gestione di portafoglio e consulenza per gli investimenti.
Lombard Odier Investment Managers (“LOIM”) è un marchio commerciale.
Questo documento è fornito esclusivamente a scopo informativo e non costituisce un’offerta o una raccomandazione di acquisto o vendita di titoli o servizi. Il presente documento non è destinato a essere distribuito, pubblicato o utilizzato in qualunque giurisdizione in cui tale distribuzione, pubblicazione o utilizzo fossero illeciti. Il presente documento non contiene raccomandazioni o consigli personalizzati e non intende sostituire un'assistenza professionale in materia di investimenti in prodotti finanziari. Prima di effettuare una transazione qualsiasi, l’investitore dovrebbe valutare attentamente se l’operazione è idonea alla propria situazione personale e, ove necessario, richiedere una consulenza professionale indipendente riguardo ai rischi e a eventuali conseguenze legali, normative, creditizie, fiscali e contabili. Il presente documento è proprietà di LOIM ed è rivolto al destinatario esclusivamente per uso personale. Il presente documento non può essere riprodotto (in tutto o in parte), trasmesso, modificato o utilizzato per altri fini senza la previa autorizzazione scritta di LOIM. Questo documento riporta le opinioni di LOIM alla data di pubblicazione.
Né il presente documento né copie di esso possono essere inviati, portati o distribuiti negli Stati Uniti d’America, nei loro territori e domini o in aree soggette alla loro giurisdizione, oppure a o a favore di US Person. A tale proposito, con l’espressione “US Person” s’intende un soggetto avente cittadinanza, nazionalità o residenza negli Stati Uniti d’America, una società di persone costituita o esistente in uno qualsiasi degli stati, dei territori, o dei domini degli Stati Uniti d’America, o una società di capitali disciplinata dalle leggi degli Stati Uniti o di un qualsiasi loro stato, territorio o dominio, o ogni patrimonio o trust il cui reddito sia soggetto alle imposte federali statunitensi, indipendentemente dal luogo di provenienza.
Fonte dei dati: se non indicato diversamente, i dati sono elaborati da LOIM.
Alcune informazioni sono state ottenute da fonti pubbliche ritenute attendibili, ma in assenza di una verifica indipendente non possiamo garantire la loro correttezza e completezza.
I giudizi e le opinioni qui espresse hanno esclusivamente scopo informativo e non costituiscono una raccomandazione di LOIM a comprare, vendere o conservare un titolo. I giudizi e le opinioni sono validi alla data della presentazione, possono essere soggetti a modifiche e non devono essere intesi come una consulenza di investimento. Non dovrebbero essere intesi come una consulenza di investimento.
Il presente documento non può essere (i) riprodotto, fotocopiato o duplicato, in alcuna forma o maniera, né (ii) distribuito a persone che non siano dipendenti, funzionari, amministratori o agenti autorizzati del destinatario, senza il previo consenso di Lombard Odier Funds (Europe) S.A. ©2021 Lombard Odier IM. Tutti i diritti riservati.


