investment viewpoints
Climate bonds: assessing avoided emissions


Assessing the carbon profile of projects funded by our Global Climate Bond strategy is crucial to determining the climate mitigation potential of our investments. As carbon is the ‘currency’ of climate change, our independent analysis is aimed at mitigating the lack of harmonisation and different degrees of sophistication characterising issuers’ reporting on avoided greenhouse gas (GHG) emissions.
The Carbon Yield® methodology1 quantifies one of the environmental impacts of the strategy in terms of greenhouse gas (GHG) emissions avoided through financed activities per USD invested. The methodology estimates the difference between:
- The carbon footprint of the funded projects
- The GHG emissions that would have occurred under a reasonable baseline scenario if those projects had not been implemented
Figure 1. The Carbon Yield® method to quantify avoided GHG emissions
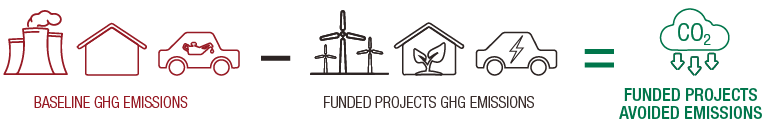
Source: AIM, LOIM. For illustrative purposes only.
The difference represents the emissions that are potentially avoided by a given project2. Individual bond avoided emissions figures are aggregated to determine the portfolio–weighted GHG emissions avoided per unit of capital invested, ie the Carbon Yield®. The results of the funded projects’ GHG analysis in 2020 are summarised in figure 2. Through its 2020 holdings, the strategy avoided 126,622tCO2e due to the projects funded. This equates to a significant 70% GHG emissions savings.
Figure 2. Avoided emissions: 70% GHG emissions savings
|
CARBON YIELD |
⇒
⇒ |
Equivalent to the emissions resulting from the average annual electricity consumption of 300 households in the United Kingdom.
Equivalent to the emissions resulting from over 1 million km driven by an average passenger vehicle in the United States.
|
|
|
This equates to 70% GHG emissions savings. This represents the percentage difference between the footprint of the average baseline project and the footprint of the average funded project. Calculations are based on project-level scope 1 & 2 emissions. |
126,622tCO2 e avoided per year due to the projects funded by the bonds held. Calculations are based on the International Energy Agency’s (IEA’s) Stated Policies Scenario (STEPs). Calculations are based on project-level scope 1 & 2 emissions. |
Scope 1 & 2 |
emissions 53,631 tCO2e Estimated to arise from the operations of the funded projects. |
|
Scope 1, 2 & 3 |
emissions 69,710 tCO2e Estimated to arise when the construction and material use of the funded projects is also accounted for. |
||


Source: AIM, LOIM. For illustrative purposes only.
Renewables: setting dynamic baselines
This year’s Impact Report differs from previous years in setting a dynamic baseline for avoided emissions in the renewables sector. While the change may result in lower estimated GHG emissions savings, it is the result of a more robust and conservative baseline-setting exercise that reflects our commitment to reporting impact using the best practice available.
In previous years, AIM conducted the analysis by assuming a static, business-as-usual scenario that implied the use of a ‘status quo’ baseline over the lifetime of a given funded project. For renewable energy projects in 2020, the decision was made to replace business-as-usual baselines with dynamic baselines that take into consideration future changes in the composition of electricity grids across the globe, and consequent changes in their emission intensity, under rigorous scenarios.
For a renewable energy power-generating asset, avoided emissions are represented by the GHG emissions savings that are potentially enabled by the substitution of grid electricity (baseline scenario) with electricity from renewable sources generated through the funded project.
The generation mix of electricity grids across the globe has changed considerably in recent years. Figure 3 shows the recent development of grid emission factors in the United States and the European Union as well as future estimated emission factors derived from IEA projections under different scenarios as defined in the 2020 World Energy Outlook (WEO)3. Both grids, to different extents, have undergone substantial decarbonisation paths. This global trend is then projected to be reinforced by the increased ambition of climate policies, technology progress and market development that will lead to a larger uptake of renewables and lesser reliance on fossil fuels.
Figure 3. Carbon intensity of the electricity grid in the US and EU
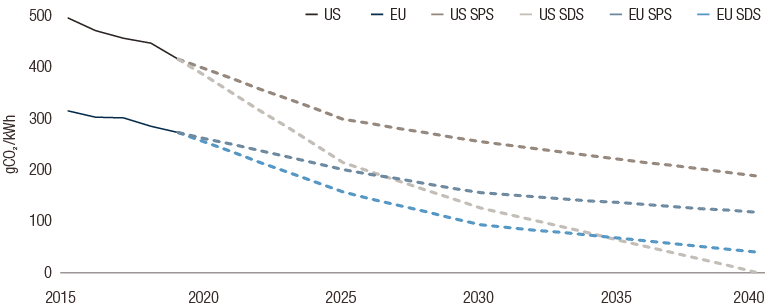
Source: LOIM, AIM elaboration based on EIA and EEA (historical data) and IEA 2020 WEO (future projections). For illustrative purposes only.4
In light of the above, AIM deemed that static, business-as-usual baselines—i.e. point-in-time grid emission factors—should be replaced with emission factors reflecting the expected evolution of the energy mix during a given project’s lifetime.
For 2020, the dynamic baselines were based on the IEA’s Stated Policies Scenario (STEPS)5. The STEPS scenario "reflects the impact of existing policy frameworks and today’s announced policy intentions". In addition, the same analysis was undertaken using the IEA’s Sustainable Development Scenario (SDS)6 as a baseline, reflecting the development of a Paris-aligned electricity mix. Both baselines were normalised figures of the expected grid composition during a project’s lifetime.
Overall, this methodological development for calculating the avoided emissions of renewable energy projects is in line with our commitment to best-practice impact reporting, even when upgraded methodologies may, at first glance, shed an unfavourable light on the impact achieved by our investments, such as their potential for climate-change mitigation.
In future, we will consider extending this scenario-based approach to other green project categories.
Please click here to read the full impact report.
Sources
Wichtige Informationen.
NUR FÜR PROFESSIONELLE INVESTOREN
Dieses Dokument wurde von Lombard Odier Funds (Europe) S.A. herausgegeben, einer in Luxemburg ansässigen Aktiengesellschaft mit Sitz an der Route d’Arlon 291 in 1150 Luxemburg, die von der Luxemburger Finanzmarktaufsichtsbehörde, („CSSF“), als Verwaltungsgesellschaft im Sinne der EU-Richtlinie 2009/65/EG in der jeweils geltenden Fassung und der EU-Richtlinie 2011/61/EU über die Verwalter alternativer Investmentfonds (AIFMD-Richtlinie) zugelassen wurde und deren Aufsicht unterstellt ist. Geschäftszweck der Verwaltungsgesellschaft ist die Errichtung, Vermarktung, Administration, Verwaltung und der Vertrieb von luxemburgischen und ausländischen OGAW, alternativen Investmentfonds („AIF“) sowie anderen regulierten Fonds, kollektiven und sonstigen Anlagevehikeln sowie das Angebot von Portfolioverwaltungs- und Anlageberatungsdiensten.
Lombard Odier Investment Managers („LOIM“) ist ein Markenzeichen.
Dieses Dokument wird ausschließlich zu Informationszwecken bereitgestellt und stellt weder ein Angebot noch eine Empfehlung zum Kauf oder Verkauf eines Wertpapiers oder einer Dienstleistung dar. Es darf nicht in Rechtsordnungen verbreitet, veröffentlicht oder genutzt werden, in denen eine solche Verbreitung, Veröffentlichung oder Nutzung rechtswidrig wäre. Dieses Dokument enthält keine personalisierte Empfehlung oder Beratung und ersetzt keinesfalls eine professionelle Beratung zu Anlagen in Finanzprodukten. Anleger sollten vor Abschluss eines Geschäfts die Angemessenheit der Investition unter Berücksichtigung ihrer persönlichen Umstände sorgfältig prüfen und gegebenenfalls einen unabhängigen Fachberater hinsichtlich der Risiken und etwaiger rechtlicher, regulatorischer, finanzieller, steuerlicher und buchhalterischer Auswirkungen konsultieren. Dieses Dokument ist Eigentum von LOIM und wird den Empfängern ausschließlich zum persönlichen Gebrauch überlassen. Es darf ohne vorherige schriftliche Genehmigung von LOIM weder ganz noch auszugsweise vervielfältigt, übermittelt, abgeändert oder für einen anderen Zweck verwendet werden. Dieses Dokument gibt die Meinungen von LOIM zum Datum seiner Veröffentlichung wieder.
Weder das vorliegende Dokument noch Kopien davon dürfen in die USA, in die Gebiete unter der Hoheitsgewalt der USA oder in die der Rechtsprechung der USA unterstehenden Gebiete versandt, dorthin mitgenommen, dort verteilt oder an US-Personen bzw. zu deren Gunsten abgegeben werden. Als US-Person gelten zu diesem Zweck alle Personen, die US-Bürger oder Staatsangehörige sind oder ihren Wohnsitz in den USA haben, alle Personengesellschaften, die in einem Bundesstaat oder Gebiet unter der Hoheitsgewalt der USA organisiert sind oder bestehen, alle Kapitalgesellschaften, die nach US-amerikanischem Recht oder dem Recht eines Bundesstaates oder Gebiets, das unter der Hoheitsgewalt der USA steht, organisiert sind, sowie alle in den USA ertragssteuerpflichtigen Vermögensmassen oder Trusts, ungeachtet des Ursprungs ihrer Erträge.
Datenquelle: Sofern nicht anders angegeben, wurden die Daten von LOIM aufbereitet.
Obwohl gewisse Informationen aus als verlässlich geltenden öffentlichen Quellen stammen, können wir ohne eine unabhängige Prüfung die Genauigkeit oder Vollständigkeit aller aus öffentlichen Quellen stammenden Informationen nicht garantieren.
Die in diesem Dokument geäußerten Ansichten und Einschätzungen dienen ausschließlich Informationszwecken und stellen keine Empfehlung von LOIM zum Kauf, Verkauf oder Halten von Wertpapieren dar. Die Ansichten und Einschätzungen entsprechen dem Stand zum Zeitpunkt dieses Dokuments und können sich ändern. Sie sind nicht als Anlageberatung zu verstehen.
Dieses Material darf ohne vorherige Genehmigung von Lombard Odier Funds (Europe) S.A. weder vollständig noch auszugsweise (i) in irgendeiner Form oder mit irgendwelchen Mitteln kopiert, fotokopiert oder vervielfältigt oder (ii) an Personen abgegeben werden, die nicht Mitarbeiter, leitende Angestellte, Verwaltungsratsmitglieder oder bevollmächtigte Vertreter des Empfängers sind. ©2021 Lombard Odier IM. Alle Rechte vorbehalten.


