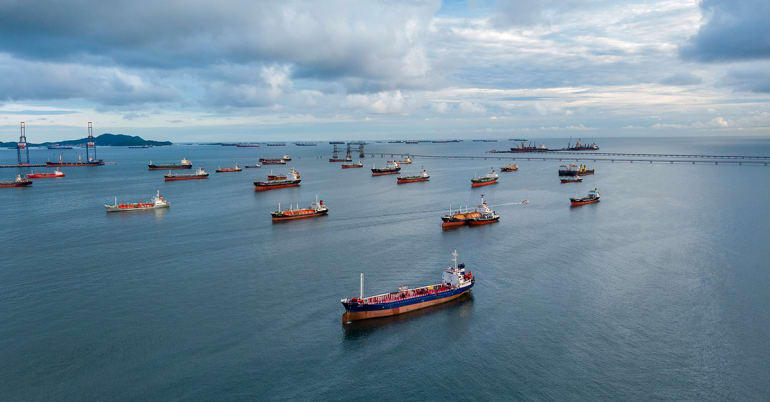
The Iran conflict has put a long-standing investment theme – the energy vulnerability of countries – back on the agenda. Markets initially fell together but regional differences have emerged, given the exposure of Europe and Asia’s economies and listed markets to oil- and gas-price spikes. More than 40% of energy shipments through the Strait of Hormuz goes to India, China and other Asian countries, making energy scarcity a near-term concern. Europe, meanwhile, is highly sensitive higher global gas and energy costs, presenting an inflation challenge.
With oil shocks being typically stagflationary, Simply put examines how different regions are being affected in the short and medium term.
Read more: Oil prices and the Middle East conflict: the economic shock investors should watch
In the short-term, watch for dependencies on energy imports and fossil fuels
The scarcity story – how dependent countries are on imported fossil fuels – matter in the short term. Two key metrics help us explore this1:
- Energy-import dependency. This shows how reliant a country is on imported energy. It is calculated as net energy imports (imports minus exports) divided by total energy use, and expressed as a percentage. A higher percentage means greater dependency on foreign energy sources, with 100% indicating complete reliance. Countries that export more energy than they import have negative values, but these are often capped at zero in analyses (as done here). The World Bank and International Energy Agency use this standard measure to identify vulnerability to supply disruptions
- Fossil-fuel dependency. This measures the percentage of a country's total energy that comes from fossil fuels. The index ranges from zero to 100, where zero indicates no fossil fuels at all and 100 a total reliance on fossil fuels. The calculation divides fossil fuel energy consumption by total energy use, which is multiplied by 100. Our analysis uses data from the Energy Institute’s 2025 Statistical Review of World Energy, which employs a consistent ‘substitution method’ to ensure fair comparisons across countries.
Read more: Could a stock market correction dilute the impact of AI capex on the US economy?
Figure 1 presents the result of this analysis, which challenges several preconceived ideas:
- Asia is most dependent on fossil fuels, but this headline figure masks differences by country. China’s progress on solar electricity groups it with the US, a net energy exporter
- But Asia is the least dependent on oil imports. Even China, which buys 10% of the oil transiting through Hormuz, has a diversified fossil-fuel supply that partially frees it from a one-way reliance on oil.
This indicates that Asia’s exposure to fossil fuels is not concentrated on a single product. Europe’s nuclear and hydroelectric power sources means it shows less dependency on fossil fuels, but it has a stronger dependency on oil itself. It sources little oil from the Middle East, and none from Iran, but oil price surges have a direct impact on the cost of its imports from elsewhere. The US has not been dependent on oil imports since the Obama administration, but is still significantly reliant on fossil fuels.
Having established the dependencies of each region, the next question is: which zone is the most vulnerable to an oil shock over the medium term?
FIG 1. Oil imports and fossil fuels: regional and national dependencies 2
Growth versus inflation consequences
Oil shocks typically drive higher inflation and/or slower economic activity, given their impacts on industry. These consequences have been clearly identified, with Lutz Kilian of the Federal Reserve Bank of Dallas noting that: “oil price shocks have differential effects on the US economy depending on their origin”3. Meanwhile, James Hamilton, in a paper for the Brookings Institute, concludes that they “have caused a significant drag on economic growth in the US and elsewhere”4.
Just as no two oil shocks are alike, countries respond differently given their respective inflation and economic activity factors. Figure 2 shows the correlation of inflation and industrial production in the 12 months that follow a spike in energy prices, looking at different fossil fuel energy sources (WTI and Brent for oil and the Dutch Title Transfer Facility (TTF) for gas, which is imported predominantly by Europe). These charts cast some light on the medium-term prospects for Asia and Europe versus the US:
- Inflation. Asia appears less exposed than Europe, whose economy is extremely sensitive to spikes in TTF prices – which is precisely what has happened recently with a price rise of up to 90%5 – and the US is also sensitive to gas prices. This is problematic because the Federal Reserve (Fed) and European Central Bank (ECB) may have to deal with a supply-driven inflation shock, and we know little of their reaction function. At the Fed, a new Chair will soon take the helm, and Christine Lagarde is expected to step down as ECB President before her term expires in October 2027. Additionally, Europe has been adamant about fighting inflation recently
- Industrial production. As a net exporter of oil, the US should not necessarily face a contraction in industrial production if oil prices rise. Europe and China, however, are impacted by higher oil and gas prices, with roughly the same levels of negative correlation. Europe is less reliant on industrial production, which accounts for 15% of its GDP, compared to 25% for China and 35% for Asia as a region.
In summary, Europe is exposed to inflationary pressures and constrained industrial production. Asia appears less impacted by inflation but industrial activity could be impeded in the near-term due to higher energy prices – even though such impacts are likely to be transitory. Beneath these regional headlines, however, vulnerabilities differ by country.
FIG 2. Inflation and industrial production: correlations with an oil shock by region6
Read more: In today’s Goldilocks economy, carry is a key driver in equities and fixed income
Key vulnerabilities: short- to medium-term view
The vulnerabilities of regions and countries to this energy-price surge boils down to identifying which are likely to be more exposed to higher inflation and constrained industrial production. Figure 3 shows the 10 areas most impacted by inflation and industrial production risks. Our conclusions are simple:
- Short term. Asia is facing a potential energy-scarcity problem – but this is partially offset by its diversification of fossil-fuel import sources. Europe faces more immediate inflation pressure, particularly through its gas dependency. The US appears immune to the scarcity problem given its status as an oil producer
- Medium term. Europe's dual vulnerability to both inflation and industrial contraction suggests a more challenging adjustment period, with added monetary policy complications as countries newly admitted to the eurozone are already experiencing inflation above 2%. Any pressures on Asia's industrial sector can be alleviated by supportive interest rates, as inflation is less of an issue, and India and East Asian countries are likely to be potentially more exposed than China.
FIG 3. Oil shock correlation to inflation and industrial production by country7
Growth drivers underpin Asia’s resilience
Despite the energy shock, structural growth drivers continue to support Asia. The region’s markets are benefiting from a multi-year phase of abundant liquidity underpinned by lower US rates, regional monetary-policy easing, capital repatriation and the depth of Chinese savings. Despite the aforementioned lack of clarity regarding the Fed’s future rate path, we see few scenarios that would meaningfully challenge this constructive pathway.
Read also: Asia and EM in 2026: accelerating momentum in credit and equities
Despite China’s continuing oil imports, it has also emerged as the global leader in the green electrification – most visible in its dominance of solar and battery technologies. The shift toward regionalised supply chains, accelerated since the first trade dispute with Donald Trump in 2018, is also advantageous, while consumer dynamics and ageing demographics are accelerating AI adoption and productivity‑enhancing investment.
Simply put, Europe's vulnerability to the oil shock is primarily through inflation pressures. Asia’s exposure, via industrial activity, is unlikely to detract from its structural growth drivers.
subscribe to investment insights and strategy updates
Preference Centre
Macro/nowcasting corner
The most recent evolution of our proprietary nowcasting indicators for global growth, global inflation surprises, and global monetary policy surprises is designed to track the latest progression of macroeconomic factors driving the markets.
Our nowcasting indicators currently show:
- Our world growth nowcaster increased, driven by a strong rebound in China on the back of improved export data, although the eurozone declined
- Our inflation indicators have increased, except in the US where it declined. The rise in the eurozone inflation nowcaster pushed it to the 50% threshold
- Our monetary policy signal remained broadly unchanged, with a slight decrease in both the US and China.
World growth nowcaster: long-term (left) and recent evolution (right)
World inflation nowcaster: long-term (left) and recent evolution (right)
World monetary policy nowcaster: long-term (left) and recent evolution (right)
Reading note: LOIM’s nowcasting indicator gather economic indicators in a point-in-time manner in order to measure the likelihood of a given macro risk – growth, inflation surprises and monetary policy surprises. The nowcaster varies between 0% (low growth, low inflation surprises and dovish monetary policy) and 100% (the high growth, high inflation surprises and hawkish monetary policy).