investment viewpoints
Alphorum: think fallen angels for attractive high-yield convexity


In the sixth and final insight for the Q4 2021 issue of Alphorum, we share findings from our research on the performance characteristics of companies that have descended from investment-grade status – the so-called fallen angels of high yield – in different market environments.
Our research report follows earlier commentaries from this issue of Alphorum:
- Lead commentary: our CIO responds to the diverse financial, macro and sustainability risks and opportunities coursing through markets
- Developed market and inflation-linked bonds: from the US to Europe to Asia, narratives for hiking interest rates are solidifying or actually playing out
- Sustainable fixed income: real efforts to accurately capture the effects of environmental risks on credit performance should withstand accusations of greenwashing in a year of record sustainability-bond issuance
- Corporate credit: as markets acknowledge the imperfections of this recovery, spreads are widening in certain sectors
- Emerging markets: responses to the risk of inflation vary across the universe, while slowing but stable global growth supports sovereigns as the tailwind of healthy current accounts eases
For now, let’s return to our research programme, where our analysis of the performance patterns of fallen angels in different market environments shows how these issuers can provide investors with a source of high-yield convexity – an attractive characteristic for credit portfolios.
Fallen angels: a source of asymmetric beta
So-called ‘fallen angels’ are borrowers who have been downgraded from investment grade to high yield (usually from BBB to BB). Although the boundary between investment grade and high yield is somewhat artificial, the two universes tend to appeal to different classes of investors. More risk-averse and benchmarked investors often sell out of downgraded bonds, a tendency which has been fueled by the rise of passive indexation benchmarked to bond indices. This results in dislocations which are a potential source of outperformance.
A number of structural elements in the way that the fallen angels universe is formed, which we explore later in this piece, gear the asset class towards a greater exposure to credit market returns in recovery periods. One way to test exposure to different market regimes is to calculate conditional betas of the universe of fallen angels to the broader high yield universe. Panel B of Figure 1 shows the excess returns of the fallen angel universe when compared to the global high-yield credit universe, both unconditionally and conditional on up and down moves. As you can see, the unconditional beta is close to 1, indicating similar market exposures as the high-yield index over the full cycle. However, on the downside (during negative market returns) the conditional beta is 10% lower, while on the upside (during positive market returns) it is over 20% higher. Therefore, fallen angels provide a convex high-yield exposure – that is, they outperform in a recovery (while falling less in a selloff). This net positive convexity, also known as ‘asymmetric beta’, comes both from a reversal of price overreaction and from the increased exposure to recovering sectors which fallen angels provide.
FIG 1: Outperformance of fallen angels compared to global high-yield credit
|
A: Excess returns of fallen angels vs global high-yield credit |
B: Beta of fallen angels compared to global high-yield credit |
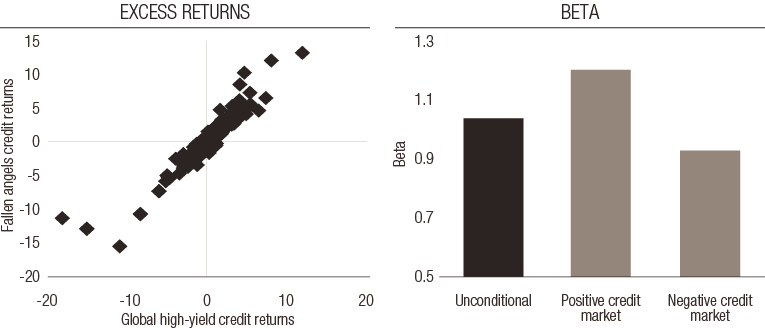
Source: Bloomberg indices, LOIM calculations as at September 2021. For illustrative purposes only.
Supply dynamics of fallen angels
Historically, the supply of new fallen angels is highly correlated with economic cycles. By definition, supply will peak in the downgrade cycle as credit-rating agencies react to stressed economic and market environments, a process that tends to lead the bottom of credit selloffs. As an example, the COVID-19 crisis generated a 12-month rolling supply of fallen angels in the US dollar market of USD 195bn, which, in absolute terms, is the largest ever recorded. European market supply was just shy of all-time highs at EUR 55bn. Largely as a result, the fallen angels universe currently stands at around USD 400bn in size.
This countercyclical uptick in supply increases the weight of ‘new’ fallen angels within the overall fallen angels universe just before credit market rallies, as shown in Figure 2. This is a very favourable dynamic, which can be exploited further through a relative-value approach.
FIG. 2: Fallen angels supply vs market returns
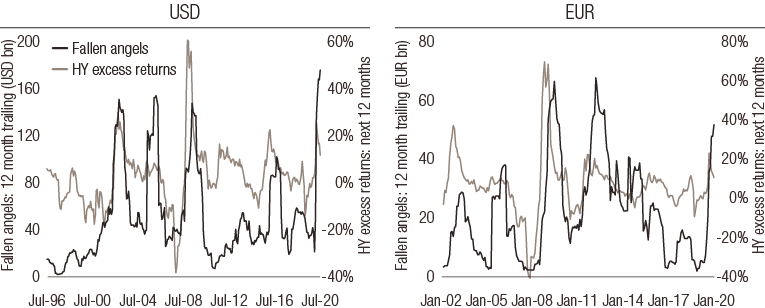
Source: Bloomberg indices, LOIM calculations as at September 2021. For illustrative purposes only
It is interesting to note that the ratings distribution of fallen angels has been relatively stable over time and has actually improved, with a greater proportion of BBs. What’s more, in contrast to high-yield, we expect the quality of the fallen angels universe to be counter-cyclical as a credit selloff should result in more BBs entering this segment.
The age of fallen angels as a factor in outperformance
Our analysis shows that a large part of the reversion in fallen angels is realised in the first year after being downgraded. This raises the possibility of overweighting newer fallen angels while being underweight aged ones. Figure 3 shows the average credit excess returns for fallen angels split by the length of time from downgrade. The one-to-six-months cohort outperforms but is also much more volatile. The six-to-12 months cohort also performs strongly but demonstrates lower volatility and a marginally higher Sharpe ratio. Finally, the 12-plus months cohort significantly underperforms the broad index.
The asymmetric beta angle is also more pronounced for newer fallen angels. The one-to-six months cohort exhibits a beta of 1.45 to market rallies, while their lower participation in selloffs is reflected in a downside conditional beta of 0.87. However, beyond a year from downgrade the effect fades, with fallen angels behaving broadly in line with their high-yield peers.
FIG 3: Average credit excess returns of fallen angels sorted by months from downgrade
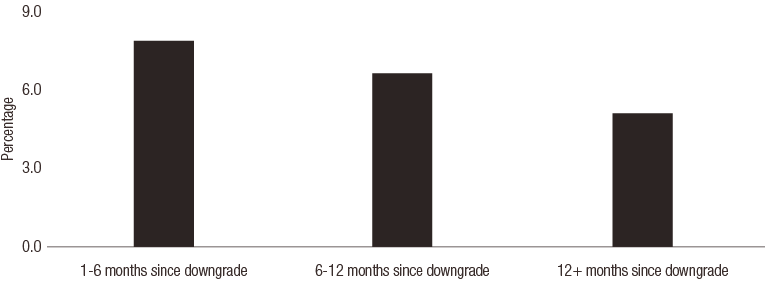
Source: LOIM Calculations as at September 2021. Return and volatility figures are annualised. Conditional Betas calculated against excess returns of Global HY index. Past performance is not a guarantee of future results.
|
Summary statistics by time since downgrade
|
Playing the recovering sectors
While market overreaction and subsequent reversion in terms of individual borrowers is an important factor in outperformance, fallen angels tend to be just as much a sector-recovery play. Whole sectors that are under the greatest pressure tend to overreact, with that overreaction exacerbated for the fallen angels within that sector.
As shown in figure 4A, the largest sectors for fallen angels have shifted over time, reflecting sector-specific leverage cycles. The early 2000s saw a resurgence in technology and telecom fallen angels, while in 2005 the major downgrades of Ford and GM meant the auto industry dominated1. In 2008-09, the global financial crisis led to banking becoming the largest fallen angels sector, a position it held for over a decade until the Covid-19 crisis saw the auto and energy sectors come to the fore.
Consequently, the recovery of cyclically affected sectors contributes significantly to fallen angels. By reweighting sectors in the fallen angels index to be in line with sector weighting in the wider investment-grade and high-yield universes, we can see how the recovery of cyclically affected sectors contributes to the outperformance of fallen angels. In Figure 4B you can see the outperformance of the standard index versus the sector-matched index, indicating that sector composition in recovery periods contributes significantly to the strong performance of fallen angels.
FIG 4: Fallen angels: sector composition
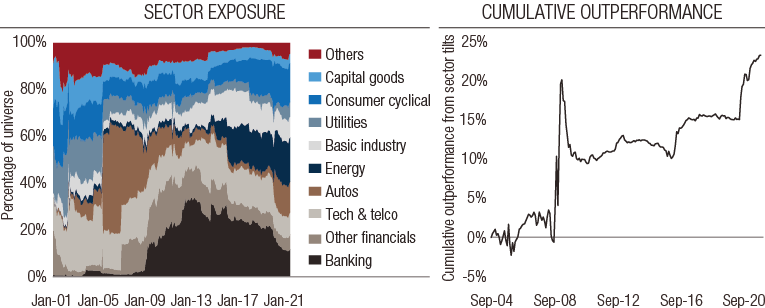
Source: Bloomberg indices, LOIM Calculations at September 2021. Past performance is not a guarantee of future results.
Conclusion
A corporate bond universe bluntly split into distinct investment-grade and high-yield markets at the BBB/BB boundary has resulted in the unique outperformance potential of the fallen angels segment. As we have shown, fallen angels provide a convex high-yield exposure, demonstrating higher returns compared to high yield in a recovery and lower drawdowns in a selloff. This outperformance is achieved through ‘valuation reversal’ rather than improved fundamentals and occurs both at an issuer-specific and sector levels, via channels that we expect to remain persistent through future cycles.
To read the full Q4 2021 issue of Alphorum, please use the download button provided.
Sources
1 Any reference to a specific company or security does not constitute a recommendation to buy, sell, hold or directly invest in the company or securities. It should not be assumed that the recommendations made in the future will be profitable or will equal the performance of the securities discussed in this document.
important information.
This document is issued by Lombard Odier Asset Management (Europe) Limited, authorised and regulated by the Financial Conduct Authority (the “FCA”), and entered on the FCA register with registration number 515393.
Lombard Odier Investment Managers (“LOIM”) is a trade name.
This document is provided for information purposes only and does not constitute an offer or a recommendation to purchase or sell any security or service. It is not intended for distribution, publication, or use in any jurisdiction where such distribution, publication, or use would be unlawful. This material does not contain personalized recommendations or advice and is not intended to substitute any professional advice on investment in financial products. Before entering into any transaction, an investor should consider carefully the suitability of a transaction to his/her particular circumstances and, where necessary, obtain independent professional advice in respect of risks, as well as any legal, regulatory, credit, tax, and accounting consequences. This document is the property of LOIM and is addressed to its recipient exclusively for their personal use. It may not be reproduced (in whole or in part), transmitted, modified, or used for any other purpose without the prior written permission of LOIM. This material contains the opinions of LOIM, as at the date of issue.
Neither this document nor any copy thereof may be sent, taken into, or distributed in the United States of America, any of its territories or possessions or areas subject to its jurisdiction, or to or for the benefit of a United States Person. For this purpose, the term "United States Person" shall mean any citizen, national or resident of the United States of America, partnership organized or existing in any state, territory or possession of the United States of America, a corporation organized under the laws of the United States or of any state, territory or possession thereof, or any estate or trust that is subject to United States Federal income tax regardless of the source of its income.
Source of the figures: Unless otherwise stated, figures are prepared by LOIM.
Although certain information has been obtained from public sources believed to be reliable, without independent verification, we cannot guarantee its accuracy or the completeness of all information available from public sources.
Views and opinions expressed are for informational purposes only and do not constitute a recommendation by LOIM to buy, sell or hold any security. Views and opinions are current as of the date of this presentation and may be subject to change. They should not be construed as investment advice.
No part of this material may be (i) copied, photocopied or duplicated in any form, by any means, or (ii) distributed to any person that is not an employee, officer, director, or authorised agent of the recipient, without Lombard Odier Asset Management (Europe) Limited prior consent. In the United Kingdom, this material is a marketing material and has been approved by Lombard Odier Asset Management (Europe) Limited which is authorized and regulated by the FCA. ©2021 Lombard Odier IM. All rights reserved


