investment viewpoints
Asian credit valuations: mind the gap


Currently, Asian USD credit offers valuation advantages compared to other major bond markets in the world, in our opinion.
While Asian USD credit markets experienced total returns in the double digit area over 2019, this was from a relatively low base at the beginning of the year when credit markets traded at very depressed levels. Although credit spreads are tighter in January 2020 compared to the beginning of 2018, we believe both investment grade (IG) and high yield (HY) markets could still offer benefits.
Asian IG: structural advantages
The Asian IG market has a lower average duration on an index level compared to the US and even Latin America, as shown in Figures 1 and 2.
Figure 1: Asian IG has higher average rating versus US and LATAM IG with a lower duration
| Asia IG | LATAM IG | US IG | |
| YTW | 3.00% | 3.95% |
2.74% |
| Spread | 123bps | 201bps |
100bps |
| Duration | 4.48 years | 7.66 years |
7.69 years |
| Average rating | A3/A- | Baa2/BBB | A3/A- |
Figure 2: Asian IG all-in yields offer value on a duration-adjusted basis
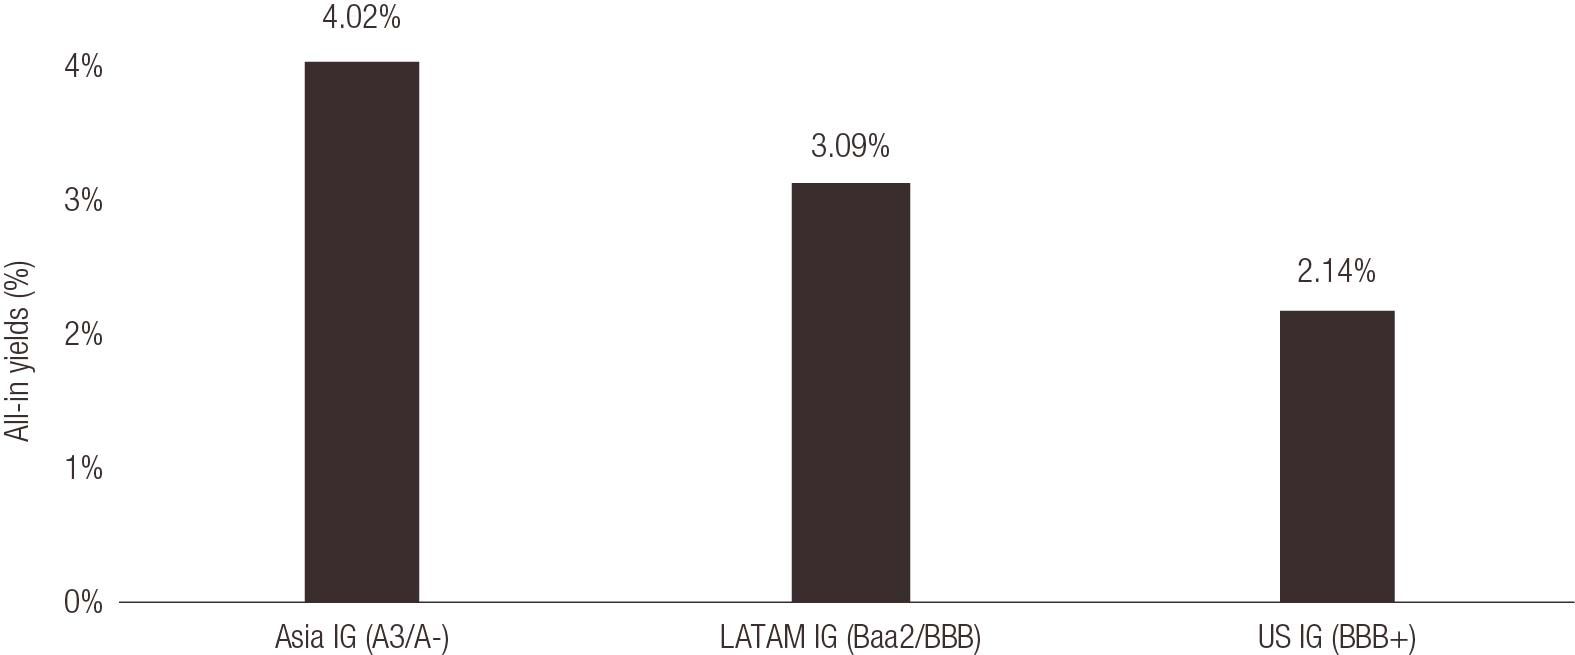
Source: Lombard Odier calculations. Bank of America Merrill Lynch and JP Morgan Index data. All index yields adjusted to a 6 year duration. As at 21 January 2020. Yields are subject to change and can vary over time. Past performance is not a guarantee of future results.
Asian HY: attractive relative value
Asian HY credit still appears cheap compared to other markets, as illustrated below. Asian HY offers improved valuation relative to both US HY as well as LATAM HY, for instance, making it the cheapest major USD-denominated HY market at present.
Figure 3: Asia HY trading wider than LATAM and US HY
| Asia HY | LATAM HY | US HY | |
| YTW | 6.26% | 5.88% |
5.18% |
| Spread | 458 | 410 |
358 |
| Duration | 2.97 | 2.78 |
3.23 |
| Average rating | Ba3/BB- | Ba3/BB- | B1/B+ |
Figure 4: Asian HY vs US HY valuation gap widened in 2019
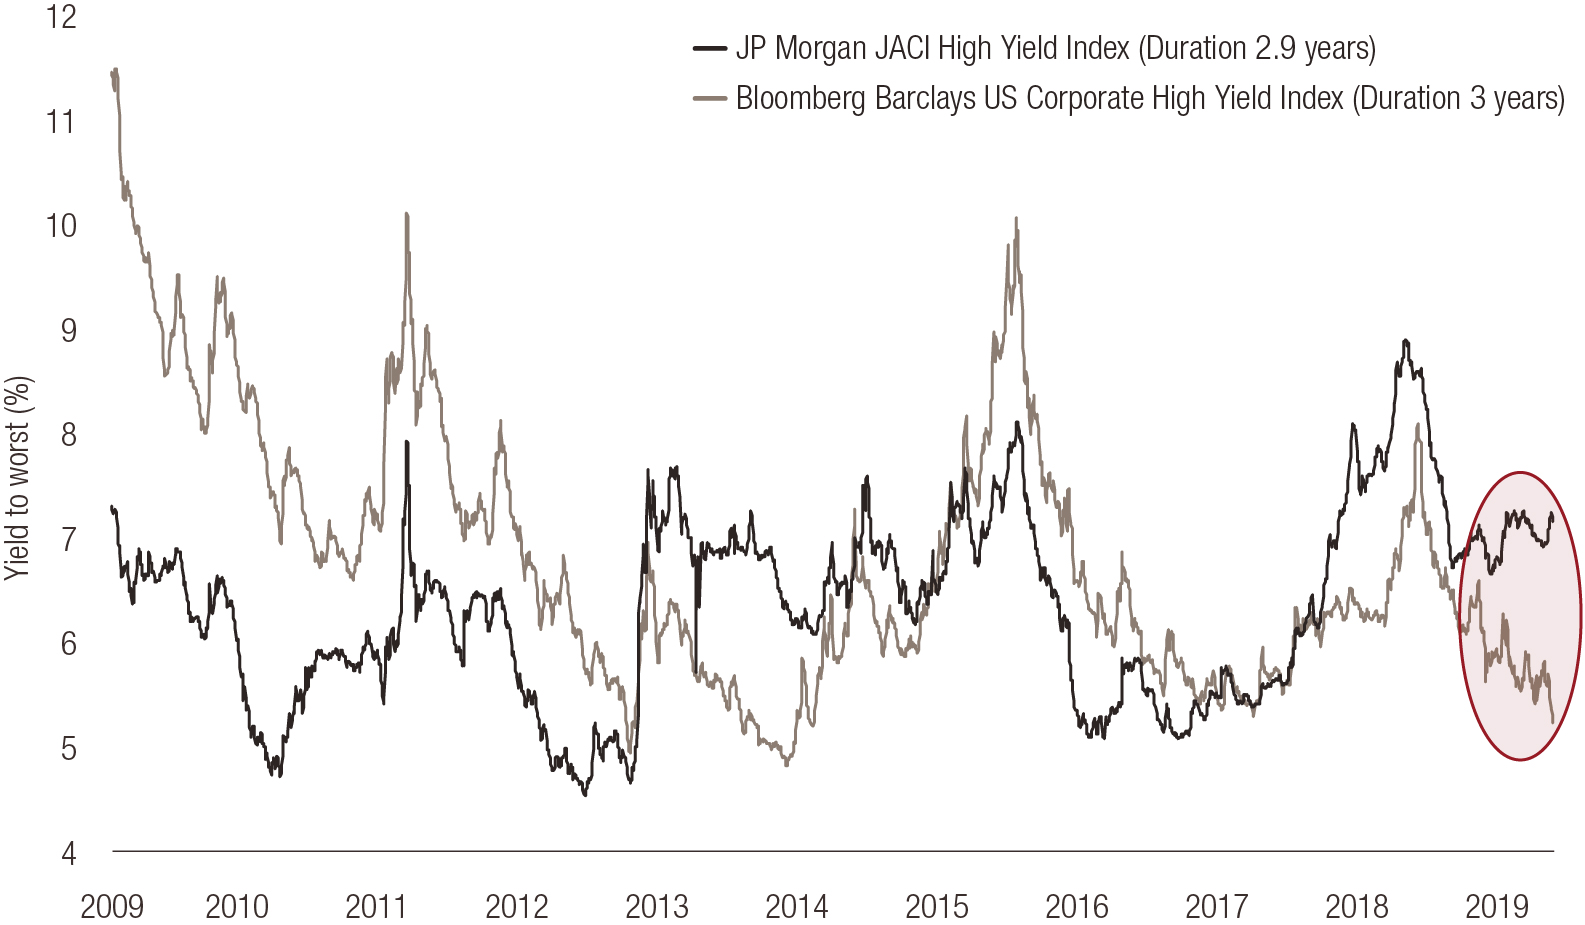
Source: Bloomberg, JP Morgan Indices, Lombard Odier. 22 January 2020. Yields are subject to change and can vary over time. Past performance is not a guarantee of future results.
In BB ratings, Asian credit could offer a spread pickup of 139bps vs US HY (ex-quasi government bonds) and 109bps vs LATAM HY. In the single B space, Asian USD credit could offer a notable 332bps wider credit spread compared to US HY and 282bps vs LATAM HY. Please refer to Figure 5 below.
We note that this wider spread in Asia comes despite the fact that Asian credit markets are deeper than LATAM markets, Asian HY companies tend to be larger in size than LATAM HY, and the Asian HY default rate has been lower historically.
We believe that investors could benefit from taking advantage of the valuation gap offered by Asian credit.
Figure 5: Asian HY spread wider than LATAM HY for comparable ratings
|
Spread |
Spread to US HY |
|
|
Overall |
425 | 9 |
|
ex. quasis1 |
463 | 47 |
|
BB |
296 | 60 |
|
B |
509 | 99 |
| Asia | 468 | 52 |
|
BB |
369 | 134 |
|
BB ex. quasis |
374 |
139 |
| B | 743 | 333 |
|
B ex. quasis |
742 | 332 |
|
Latin America |
417 | 1 |
| BB | 266 | 31 |
|
BB ex. quasis |
265 | 29 |
| B | 443 | 33 |
|
B ex. quasis |
460 | 50 |
Source: JP Morgan, Lombard Odier. As at 13 January 2020. Yields are subject to change and can vary over time. Past performance is not a guarantee of future results.
sources.
important information.
This document has been issued by Lombard Odier Funds (Europe) S.A. a Luxembourg based public limited company (SA), having its registered office at 291, route d’Arlon, 1150 Luxembourg, authorised and regulated by the CSSF as a Management Company within the meaning of EU Directive 2009/65/EC, as amended; and within the meaning of the EU Directive 2011/61/EU on Alternative Investment Fund Managers (AIFMD). The purpose of the Management Company is the creation, promotion, administration, management and the marketing of Luxembourg and foreign UCITS, alternative investment funds ("AIFs") and other regulated funds, collective investment vehicles or other investment vehicles, as well as the offering of portfolio management and investment advisory services.
Lombard Odier Investment Managers (“LOIM”) is a trade name.
This document is provided for information purposes only and does not constitute an offer or a recommendation to purchase or sell any security or service. It is not intended for distribution, publication, or use in any jurisdiction where such distribution, publication, or use would be unlawful. This material does not contain personalized recommendations or advice and is not intended to substitute any professional advice on investment in financial products. Before entering into any transaction, an investor should consider carefully the suitability of a transaction to his/her particular circumstances and, where necessary, obtain independent professional advice in respect of risks, as well as any legal, regulatory, credit, tax, and accounting consequences. This document is the property of LOIM and is addressed to its recipient exclusively for their personal use. It may not be reproduced (in whole or in part), transmitted, modified, or used for any other purpose without the prior written permission of LOIM. This material contains the opinions of LOIM, as at the date of issue.
Neither this document nor any copy thereof may be sent, taken into, or distributed in the United States of America, any of its territories or possessions or areas subject to its jurisdiction, or to or for the benefit of a United States Person. For this purpose, the term "United States Person" shall mean any citizen, national or resident of the United States of America, partnership organized or existing in any state, territory or possession of the United States of America, a corporation organized under the laws of the United States or of any state, territory or possession thereof, or any estate or trust that is subject to United States Federal income tax regardless of the source of its income.
Source of the figures: Unless otherwise stated, figures are prepared by LOIM.
Although certain information has been obtained from public sources believed to be reliable, without independent verification, we cannot guarantee its accuracy or the completeness of all information available from public sources.
Views and opinions expressed are for informational purposes only and do not constitute a recommendation by LOIM to buy, sell or hold any security. Views and opinions are current as of the date of this presentation and may be subject to change. They should not be construed as investment advice.
No part of this material may be (i) copied, photocopied or duplicated in any form, by any means, or (ii) distributed to any person that is not an employee, officer, director, or authorised agent of the recipient, without Lombard Odier Funds (Europe) S.A prior consent. ©2020 Lombard Odier IM. All rights reserved.


