global perspectives
Rates market volatility: credit as diversifier


A sharp rise in Treasury yields and global rates in general has become the dominant narrative in financial markets. Yet a pick-up in interest rates was widely expected as the economic outlook improved, so why is inflation troubling market participants, and what are the implications for fixed income investors?
We believe that current market pricing of central bank hikes appears premature, and note that credit spreads could act as a good diversifier for investors in times when interest rate risk increases.
Why are yields rising sharply?
Like the broad market, we had expected higher yields and steeper curves in 2021, but acknowledge that our ‘base’ economic scenario has proved conservative regarding the speed of the recovery and fiscal developments. The deployment of Covid-19 vaccines is well on track and mutations seem to be under control, so far.
Of even greater impact is the passing of a much larger than expected fiscal stimulus package from the Biden administration, and the prospect of an infrastructure programme,“Build Back Better”, that is estimated at USD 2-4trillion over 10 years. These factors have shifted expectations towards a significantly sharper economic rebound.
The size and speed of the nominal rate increase, as shown in Figure 1, caught markets by surprise. However, what really triggered market attention was the pickup in real yields in the second half of February. Additionally, as the selloff moved from the long-end of the yield curve into the medium- and short-term segments, it proved more impactful on the pricing of risk.
Figure 1: Nominal and real 10yr US Treasury Yield YtD
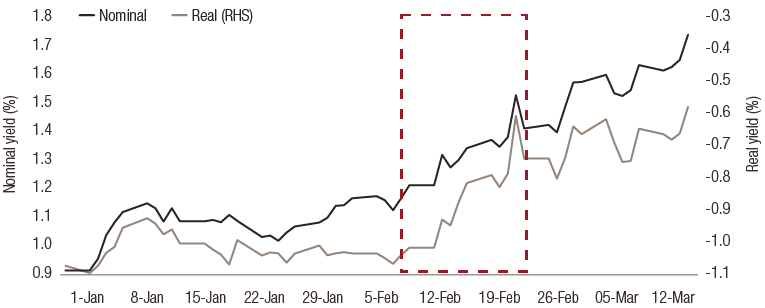
Source: Bloomberg. Real rates are calculated as 10y nominal yields minus 10y breakevens. As of 18 March 2021.
As long as nominal yield increases are driven by expectations of a more robust economic recovery, and hence increased inflation expectations, we believe the Federal Reserve (Fed) can remain comfortable in its current monetary policy stance. This scenario could also increase real yields, but would play out gradually over a long-term period, making it easier for risky assets to absorb.
A sudden, sharp rise in real yields, however, threatens to tighten financial conditions ahead of policymakers’ agendas, which would likely be countered by tweaks to monetary policy tools. The latter has increased volatility in markets more recently, and impacted risk asset performance.
Yields to be anchored by slack, gradual policy
Current market pricing of a first Fed rate hike in 2022 is at odds with the Fed’s own projections, which forecast the Fed funds rate remaining at current levels until 2024. Federal Reserve officials have been resolute in committing to the new Average Inflation Targeting (AIT) framework, and have made no suggestion that policy moves will come sooner.
Indeed, whilst the FOMC meeting in March upgraded the Fed’s projections for growth and employment, the communication reiterated that its accommodative stance remained necessary to ensure the recovery, with the updated dot plot continuing to forecast no hike before 2024. Additionally, the sequencing preferences of the Fed would not allow for such fast action, as we would expect them to test tapering asset purchases for prolonged period before any rate hikes.
To us, labour market slack remains considerable, meaning any structural inflation pressures will take time to build.
Furthermore, despite the substantial stimulus package, we continue to advocate that inflationary pressures will be more transitory this year, with structural forces continuing to be deflationary in the longer term. To us, labour market slack remains considerable, meaning any structural inflation pressures will take time to build. Base effects will likely push headline and core inflation above the Fed targets by mid-year 2021, but we expect this to normalise into year-end.
We believe nominal yields could continue to rise in the short-term, driven by liquidity and demand/supply dynamics, particularly whilst the Fed refuses to be drawn into comments on what yield level it would deem ‘too high’. However, we see less space for a longer term sustained increase in rates if signs of a structural inflation pickup fail to materialise.
Ultimately, we expect the Fed will continue to anchor real yields in negative territory. It would be receptive to higher nominal yields only if they were a reflection of economic recovery and acceleration. This should limit the scope for longer-term yields to rise substantially further in the medium term, in our view.
Credit-rates diversification
Given this backdrop, we highlight the diversification properties of credit spreads during rate selloffs, which could benefit investors over the shorter term.
Duration measures exposure to interest rate risk, but it does not take into account credit spread sensitivity. As an alternative, we use empirical duration to measure the impact of a rise in risk free rates on asset returns, which takes into account the diversifying aspect from credit spreads. Empirical duration represents the observed historical relationship between rate returns and the total returns, with a lower empirical duration indicating a lower impact from interest rates on total returns.
We use empirical duration to measure the impact of a rise in risk free rates on asset returns, which takes into account the diversifying aspect from credit spreads.
Figure 2 presents empirical duration by corporate bond segment in USD and EUR markets. Empirical duration is very significant in investment grade (IG) ratings, but is substantially lower in crossover (rated BBB and BB) and even negative in the high yield (HY) segments. We also note that this is a persistent characteristic of these segments across EUR and USD markets and both before and after the 2008 financial crisis.
Figure 2: Empirical duration1 (Jan 2002 – February 2021)
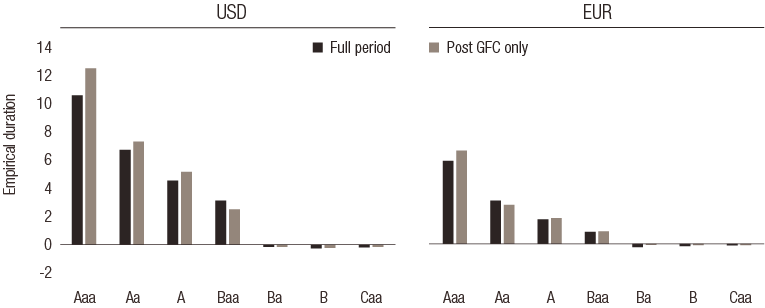
Source: LOIM calculations, Bloomberg Barclays indices. Calculated using a regression of monthly returns and end of period, option adjusted durations. Post GFC period representative of Jan 2010 – Feb 2021. Past performance is not a reliable indicator of future returns.
The reduced empirical duration in lower rated assets stems from the increase in credit as a returns driver, coupled with a broadly negative correlation between interest rates and credit spreads over long-term horizons. Such a relationship indicates that lower rated assets could provide diversification2 in times of interest rate selloffs.
In Figure 3 we report the average annualised total returns of segments in periods of interest rate selloffs. In line with the empirical durations, segments with increased credit exposure (crossover and high yield) show flat to positive returns in nominal rate sell off periods, because of the diversification from the credit component. On the contrary, the duration-dominated IG segments suffer heavily.
However, this research also presents an important point for the rates-credit diversification narrative, as shown by performance in real rates drawdown periods in Figure 3. In this scenario, the protection from credit/rates diversification is reduced as risk assets also reprice due to tightening financial conditions. This is an important caveat to highlight within the relationship of rates and credit, but we stress that it is focused in periods of sharp real rate sell offs – a scenario which we do not envisage materialising in the coming year under the current Fed policy framework.
Figure 3: Average monthly total returns by corporate rating in rate sell off periods (annualised, Jan-97 to Feb-21)
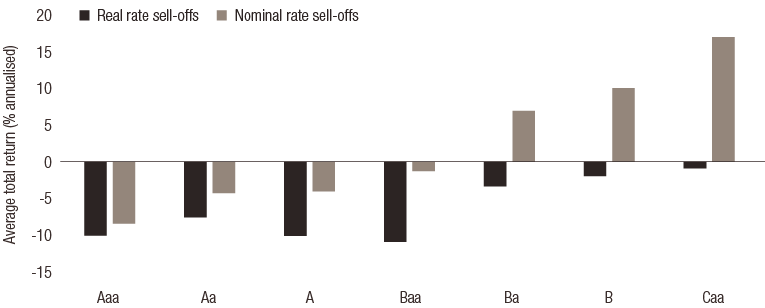
Source: Bloomberg Barclays indices, LOIM Calculations. Calculated using monthly US market data. Sell off periods are determined by the peak to trough dates of rates periods with a minimum selloff of 0.04, as measured by total return divided by duration. Yields are subject to change and can vary over time. Past performance is not a reliable indicator of future returns.
Credit as long-term diversifier
In summary, our view into the rest of the year sees any further increase in nominal yields being largely driven by inflation expectations, with real rate moves to be closely managed by central banks. Under such a scenario, we expect the diversification properties of credit to persist with scope for spreads to tighten from current levels. From an asset allocation perspective, this favours the higher spread segments of the credit spectrum, in our opinion.
Strategy positioning
Our corporate credit funds in crossover and Swiss francs benefit from their structural composition. As shown previously, segments with higher spreads benefit from credit returns contributing more to performance versus lower spread segments in interest rate sell off periods.
Secondly, our fixed income aggregate strategies (global fixed income opportunities and Swiss franc bond strategies) are designed to give us the scope to actively position. We build flexibility into our investment process to enable us to intervene and take advantage of certain opportunities or buffer against specific risks.
We have implemented short duration overlays tactically because we had already highlighted inflation as a key risk for 2021.
For instance, we have implemented short duration overlays tactically because we had already highlighted inflation as a key risk for 2021. This overlay applies to strategies with both active rates and credit positions. The resulting underweight in duration versus benchmarks has been a source of outperformance3 .
Furthermore, within global fixed income opportunities, the tactical asset allocation has had an underweight position in developed market sovereigns in place for several months in favour of segments where we see greater value. This has helped mitigate the drawdowns relative to those seen in global aggregate indices in particular in 2021.
sources.
important information.
This document has been issued by Lombard Odier Funds (Europe) S.A. a Luxembourg based public limited company (SA), having its registered office at 291, route d’Arlon, 1150 Luxembourg, authorised and regulated by the CSSF as a Management Company within the meaning of EU Directive 2009/65/EC, as amended; and within the meaning of the EU Directive 2011/61/EU on Alternative Investment Fund Managers (AIFMD). The purpose of the Management Company is the creation, promotion, administration, management and the marketing of Luxembourg and foreign UCITS, alternative investment funds ("AIFs") and other regulated funds, collective investment vehicles or other investment vehicles, as well as the offering of portfolio management and investment advisory services.
Lombard Odier Investment Managers (“LOIM”) is a trade name.
This document is provided for information purposes only and does not constitute an offer or a recommendation to purchase or sell any security or service. It is not intended for distribution, publication, or use in any jurisdiction where such distribution, publication, or use would be unlawful. This material does not contain personalized recommendations or advice and is not intended to substitute any professional advice on investment in financial products. Before entering into any transaction, an investor should consider carefully the suitability of a transaction to his/her particular circumstances and, where necessary, obtain independent professional advice in respect of risks, as well as any legal, regulatory, credit, tax, and accounting consequences. This document is the property of LOIM and is addressed to its recipient exclusively for their personal use. It may not be reproduced (in whole or in part), transmitted, modified, or used for any other purpose without the prior written permission of LOIM. This material contains the opinions of LOIM, as at the date of issue.
Neither this document nor any copy thereof may be sent, taken into, or distributed in the United States of America, any of its territories or possessions or areas subject to its jurisdiction, or to or for the benefit of a United States Person. For this purpose, the term "United States Person" shall mean any citizen, national or resident of the United States of America, partnership organized or existing in any state, territory or possession of the United States of America, a corporation organized under the laws of the United States or of any state, territory or possession thereof, or any estate or trust that is subject to United States Federal income tax regardless of the source of its income.
Source of the figures: Unless otherwise stated, figures are prepared by LOIM.
Although certain information has been obtained from public sources believed to be reliable, without independent verification, we cannot guarantee its accuracy or the completeness of all information available from public sources.
Views and opinions expressed are for informational purposes only and do not constitute a recommendation by LOIM to buy, sell or hold any security. Views and opinions are current as of the date of this presentation and may be subject to change. They should not be construed as investment advice.
No part of this material may be (i) copied, photocopied or duplicated in any form, by any means, or (ii) distributed to any person that is not an employee, officer, director, or authorised agent of the recipient, without Lombard Odier Funds (Europe) S.A prior consent. In Luxembourg, this material is a marketing material and has been approved by Lombard Odier Funds (Europe) S.A. which is authorized and regulated by the CSSF.
©2021 Lombard Odier IM. All rights reserved.


