investment viewpoints

Pandemic impact on credit: default risk

Pandemic impact on credit: default risk
Anando Maitra, PhD, CFA - Head of Systematic Research and Portfolio Manager

Anando Maitra, PhD, CFA

Head of Systematic Research and Portfolio Manager
Jamie Salt, CFA - Systematic Fixed Income Analyst and Portfolio Manager

Jamie Salt, CFA

Systematic Fixed Income Analyst and Portfolio Manager
Ashton Parker - Head of Credit Research

Ashton Parker

Head of Credit Research

The COVID-19 pandemic spurred a selloff of corporate bond markets in Spring 2020 that brought higher yields back into the fray as it raised concern about default risks from the sudden economic shutdown.

Global policymakers unveiled unprecedented stimulus – both fiscal and monetary – to address the effects of the pandemic and ease systemic risks. Such monetary accommodation is already strongly supporting credit spreads and more fluid credit market conditions, and will likely continue do so until the COVID-19 economic shock has eased, in our opinion.

In the past, credit spreads have generally tended to over-estimate default risks, and we point to past evidence that shows issuers tend to consistently default at a much lower rate than what is priced by the market. In addition, default risk is not spread evenly across the ratings spectrum, compositional effects are significant and there is a significant risk-premium in the BB bucket relative to historical default probabilities.

As such, credit spreads in crossover ratings – BBB to BB – more than compensate investors for the default risk, in our opinion. There are clear openings in credit markets for specialised, active managers to deliver alpha, while long-term investors could finally resolve the low yield conundrum of recent years. Our crossover strategy focuses on quality, aiming to generate higher risk-adjusted return potential compared to traditional investment grade benchmarks. 


Credit spreads tend to overestimate default risks

As credit spreads have widened significantly in Spring 2020, it is important to remember that credit is a mean-reverting asset (in the absence of defaults) through the pull-to-par effect.

A long-term buy-and-hold investor would receive the spread of a bond to compensate for future defaults. Historically, credit spreads have significantly overestimated defaults. The excess spread over future defaults, also called the credit spread premium, has reached highs in times of credit distress. Multiple academic studies attribute a large chunk of this credit spread premium to a combination of liquidity1 and jump-risk premium2.

Jump-to-default events, however, appear to be relatively rare for viable non-financial corporates, even during times of stress because, often, the banking sector as well as governments tend to be a backstop if the business is deemed viable3. Indeed, we see this dynamic in play from the very strong fiscal and monetary support provided during the current crisis.

Our empirical analysis shows that outside of accounting scandals,4 investment grade or even highly rated high yield (BB ratings) issuers tend to consistently default at a much lower rate than is priced by the market.

In Figure 1 we plot maximum spreads each year against 1-year forward default losses from Moody’s for the BBB and BB universe. Spreads – which should normally compensate for defaults – have exceeded future default losses by as much as 10x in crisis periods. The maximum annual 1-year default losses5 has been in the range of 0.6% for BBB6 and 1.5% for BB issuers. Credit spreads however reached 7% and 12% respectively in the 2008 financial crisis and 4.5% and 8% in the current crisis.


Figure 1. Spreads (max annual) vs 1-year forward defaults


Credit_Spreads-v-defaults_EN.jpg

Source: LOIM Calculations, Bloomberg Barclays indices, Moody’s. Past performance is not necessarily indicative of future returns.
 

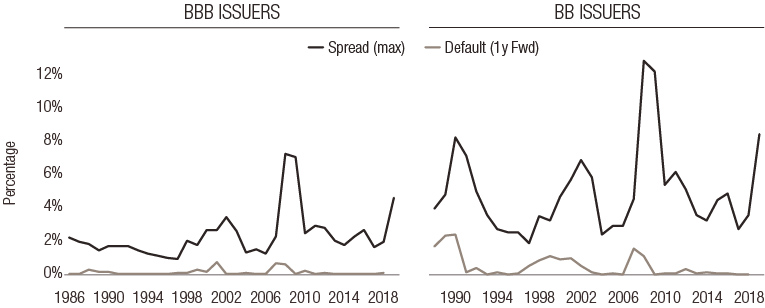
In the current crisis, US credit spreads hit their highest since the 2008 crisis, and EUR spreads are just below the peak hit during the Eurozone sovereign crisis.

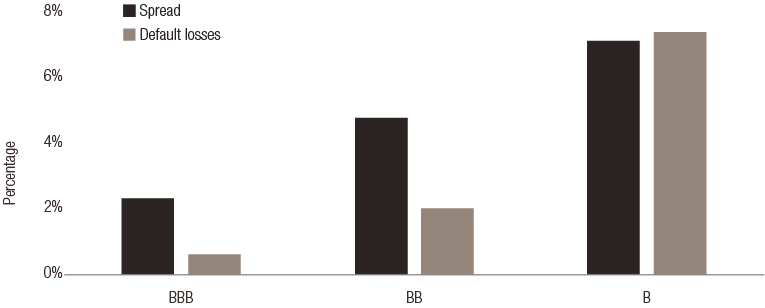
As an anchoring exercise, Figure 2 compares current spreads with the highest average default losses over the past 40 years7. Current spreads are almost 4x the historical worst-case defaults in BBBs and almost 2.5x historical worst-case defaults in BBs. In contrast, lower-rated HY issuers such as Bs have spreads that are in line with worst-case defaults.


Figure 2. Spreads at 29 May 2020 vs maximum historical default losses


Credit_Default-losses_EN.jpg

Source: LOIM Calculations, Moody’s Investor Services, Bloomberg Barclays indices.
 

Calibrating the current default cycle

Defaults are expected to be substantially higher in the wake of the sudden economic shutdown. However, unprecedented government support should help mitigate defaults, and we believe impacts will vary.

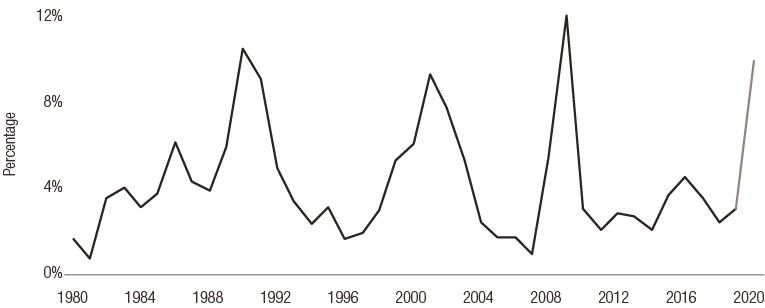
Rating agency and broker research estimate issuer-weighted speculative-grade default rate of 10%8, almost 3x pre-COVID crisis levels, and only rivalled by the 2008 crisis, as shown in Figure 3. However, we think that even at these stressed default levels, credit spreads more than compensate for defaults within standard bond indices.


Figure 3. Global Moody’s speculative grade defaults

Credit_Moodys-speculative-grade_EN.jpg

Source: Moody’s 2019 default study.
 

It is important to note that speculative grade default estimates are not comparable historically or with standard bond indices because of composition effects. Rating agency cohorts are dominated by CCC-C rated issuers from the proliferation of smaller companies raising funding from public markets. Bond indices, such as the Bloomberg Barclays high-yield corporate index, have a very different composition. This is both from differences in the issuer mix as well as the weighting scheme.

For example, Bloomberg Barclays indices have a USD 150M outstanding constraint for high-yield issuers that eliminates many small companies that are low-rated. In addition a large proportion of very low rated issuers (B- and below) are private equity owned companies that are financed by bank loans9. Finally, market-cap weighting also reduces the CCC-C rated exposure as BB-rated companies are substantially larger.

Panel A of Figure 4 shows that high-yield bond indices are dominated by BB issuance which constitutes ~ 55%, and B constituting 35%. Panel B shows that the default rates increase exponentially10 when moving down the credit spectrum, therefore composition effects can be very significant.


Figure 4. Rating composition and default rates by rating


Credit_Default-rates-by-Ratings_EN.jpg
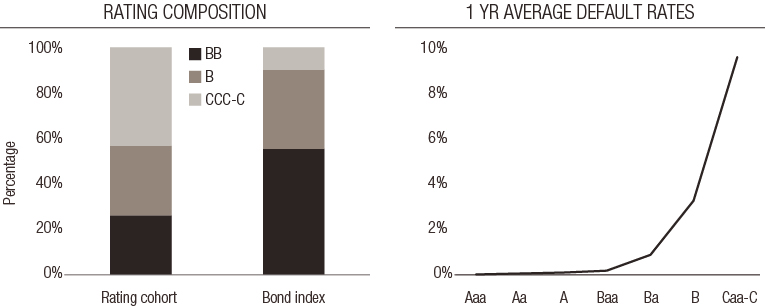
Source: Moody’s, Bloomberg Barclays indices.
 
Adjusting for compositional effects11, we find that default rates in high yield bond indices are 50% of the speculative-grade issuer-weighted default estimates from rating agencies. In other words, a default rate of 10% translates into a 5% bond-index default rate. Given recovery rates of 30%, we find that this translates into a high yield default loss of 3.5% and BB default losses of 1.4%. Current spread levels are 2x for HY and 4x for BB–rated issuers, indicating a significant risk-premium.
This reaffirms our belief that spreads more than compensate investors for the default risk, and that the crossover area of ratings best rewards investors for the risk incurred.
 

Please click here to download the full white paper entitled ‘Credit where credit is due.’


sources.

1 (Chen et al, 2007, Helwege et at, 2013, Lin et al, 2011, Van loon et al, 2014).
2 (Collin-Dufresne et al, 2001, Driessen, 2005).
3 High-grade financials have a higher jump-to-default risk from bank runs and liquidity shocks in the absence of government support. The recognition of this fact has led to significant changes in liquidity and regulatory capital requirement for banks and the issuance of bailable debt (such as AT1’s).
4 Worldcom (2002), Enron (2001), Steinhoff (2017) are some example of accounting scandals leading to jump-to-defaults for a large IG company.
5 Similar results if we annualise 3y or 5y default rates.
6 Longer term analysis shows that even in the great depression BBB default losses were below 1%.
7 We use the 90% CVAR of default losses i.e. the worst 4 default episodes in history. The annual default losses used are higher than those experienced in the 2008 financial crisis.
8 Estimates sourced from Barclays, S&P, Fitch and Deutsche Bank.
9 Based on our analysis, we find that over two-thirds of the lowest rated corporates rated by Moody’s in the US are private equity backed and therefore financed by bank loans.
10 While in stress periods default rates are higher, we find that the increase is proportional. For example, a recessionary periods sees all default rates higher by around 2-2.5x than the average. For example, the 2008 global financial crisis had 2.5x higher default rates for all ratings.
11 We use ratio of default rates for BB:B:CCC as roughly 1:3:9 consistent with historical and stress case episodes. This allows us to get the ratio of default rate for the two compositions which is 50%.

important information.

For professional investor use only
This document has been issued by Lombard Odier Funds (Europe) S.A. a Luxembourg based public limited company (SA), having its registered office at 291, route d’Arlon, 1150 Luxembourg, authorised and regulated by the CSSF as a Management Company within the meaning of EU Directive 2009/65/EC, as amended; and within the meaning of the EU Directive 2011/61/EU on Alternative Investment Fund Managers (AIFMD). The purpose of the Management Company is the creation, promotion, administration, management and the marketing of Luxembourg and foreign UCITS, alternative investment funds ("AIFs") and other regulated funds, collective investment vehicles or other investment vehicles, as well as the offering of portfolio management and investment advisory services.
Lombard Odier Investment Managers (“LOIM”) is a trade name.
This document is provided for information purposes only and does not constitute an offer or a recommendation to purchase or sell any security or service. It is not intended for distribution, publication, or use in any jurisdiction where such distribution, publication, or use would be unlawful. This material does not contain personalized recommendations or advice and is not intended to substitute any professional advice on investment in financial products. Before entering into any transaction, an investor should consider carefully the suitability of a transaction to his/her particular circumstances and, where necessary, obtain independent professional advice in respect of risks, as well as any legal, regulatory, credit, tax, and accounting consequences. This document is the property of LOIM and is addressed to its recipient exclusively for their personal use. It may not be reproduced (in whole or in part), transmitted, modified, or used for any other purpose without the prior written permission of LOIM. This material contains the opinions of LOIM, as at the date of issue.
Neither this document  nor any copy thereof may be sent, taken into, or distributed in the United States of America, any of its territories or possessions or areas subject to its jurisdiction, or to or for the benefit of a United States Person. For this purpose, the term "United States Person" shall mean any citizen, national or resident of the United States of America, partnership organized or existing in any state, territory or possession of the United States of America, a corporation organized under the laws of the United States or of any state, territory or possession thereof, or any estate or trust that is subject to United States Federal income tax regardless of the source of its income.
Source of the figures: Unless otherwise stated, figures are prepared by LOIM.
Although certain information has been obtained from public sources believed to be reliable, without independent verification, we cannot guarantee its accuracy or the completeness of all information available from public sources.
Views and opinions expressed are for informational purposes only and do not constitute a recommendation by LOIM to buy, sell or hold any security. Views and opinions are current as of the date of this presentation and may be subject to change. They should not be construed as investment advice.
No part of this material may be (i) copied, photocopied or duplicated in any form, by any means, or (ii) distributed to any person that is not an employee, officer, director, or authorised agent of the recipient, without Lombard Odier Funds (Europe) S.A prior consent. ©2020 Lombard Odier IM. All rights reserved.å