investment viewpoints
Climate bonds: assessing avoided emissions


Assessing the carbon profile of projects funded by our Global Climate Bond strategy is crucial to determining the climate mitigation potential of our investments. As carbon is the ‘currency’ of climate change, our independent analysis is aimed at mitigating the lack of harmonisation and different degrees of sophistication characterising issuers’ reporting on avoided greenhouse gas (GHG) emissions.
The Carbon Yield® methodology1 quantifies one of the environmental impacts of the strategy in terms of greenhouse gas (GHG) emissions avoided through financed activities per USD invested. The methodology estimates the difference between:
- The carbon footprint of the funded projects
- The GHG emissions that would have occurred under a reasonable baseline scenario if those projects had not been implemented
Figure 1. The Carbon Yield® method to quantify avoided GHG emissions
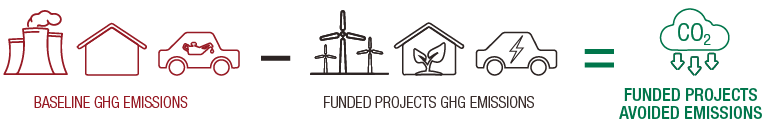
Source: AIM, LOIM. For illustrative purposes only.
The difference represents the emissions that are potentially avoided by a given project2. Individual bond avoided emissions figures are aggregated to determine the portfolio–weighted GHG emissions avoided per unit of capital invested, ie the Carbon Yield®. The results of the funded projects’ GHG analysis in 2020 are summarised in figure 2. Through its 2020 holdings, the strategy avoided 126,622tCO2e due to the projects funded. This equates to a significant 70% GHG emissions savings.
Figure 2. Avoided emissions: 70% GHG emissions savings
|
CARBON YIELD |
⇒
⇒ |
Equivalent to the emissions resulting from the average annual electricity consumption of 300 households in the United Kingdom.
Equivalent to the emissions resulting from over 1 million km driven by an average passenger vehicle in the United States.
|
|
|
This equates to 70% GHG emissions savings. This represents the percentage difference between the footprint of the average baseline project and the footprint of the average funded project. Calculations are based on project-level scope 1 & 2 emissions. |
126,622tCO2 e avoided per year due to the projects funded by the bonds held. Calculations are based on the International Energy Agency’s (IEA’s) Stated Policies Scenario (STEPs). Calculations are based on project-level scope 1 & 2 emissions. |
Scope 1 & 2 |
emissions 53,631 tCO2e Estimated to arise from the operations of the funded projects. |
|
Scope 1, 2 & 3 |
emissions 69,710 tCO2e Estimated to arise when the construction and material use of the funded projects is also accounted for. |
||


Source: AIM, LOIM. For illustrative purposes only.
Renewables: setting dynamic baselines
This year’s Impact Report differs from previous years in setting a dynamic baseline for avoided emissions in the renewables sector. While the change may result in lower estimated GHG emissions savings, it is the result of a more robust and conservative baseline-setting exercise that reflects our commitment to reporting impact using the best practice available.
In previous years, AIM conducted the analysis by assuming a static, business-as-usual scenario that implied the use of a ‘status quo’ baseline over the lifetime of a given funded project. For renewable energy projects in 2020, the decision was made to replace business-as-usual baselines with dynamic baselines that take into consideration future changes in the composition of electricity grids across the globe, and consequent changes in their emission intensity, under rigorous scenarios.
For a renewable energy power-generating asset, avoided emissions are represented by the GHG emissions savings that are potentially enabled by the substitution of grid electricity (baseline scenario) with electricity from renewable sources generated through the funded project.
The generation mix of electricity grids across the globe has changed considerably in recent years. Figure 3 shows the recent development of grid emission factors in the United States and the European Union as well as future estimated emission factors derived from IEA projections under different scenarios as defined in the 2020 World Energy Outlook (WEO)3. Both grids, to different extents, have undergone substantial decarbonisation paths. This global trend is then projected to be reinforced by the increased ambition of climate policies, technology progress and market development that will lead to a larger uptake of renewables and lesser reliance on fossil fuels.
Figure 3. Carbon intensity of the electricity grid in the US and EU
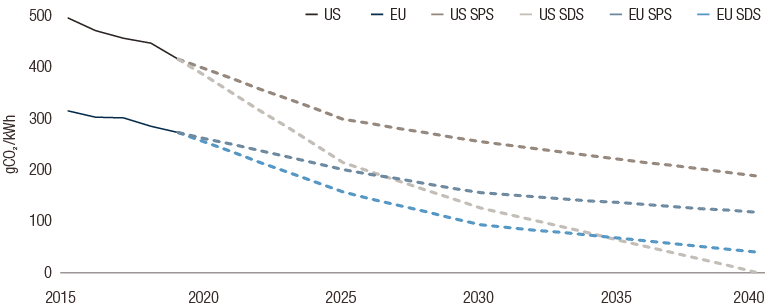
Source: LOIM, AIM elaboration based on EIA and EEA (historical data) and IEA 2020 WEO (future projections). For illustrative purposes only.4
In light of the above, AIM deemed that static, business-as-usual baselines—i.e. point-in-time grid emission factors—should be replaced with emission factors reflecting the expected evolution of the energy mix during a given project’s lifetime.
For 2020, the dynamic baselines were based on the IEA’s Stated Policies Scenario (STEPS)5. The STEPS scenario "reflects the impact of existing policy frameworks and today’s announced policy intentions". In addition, the same analysis was undertaken using the IEA’s Sustainable Development Scenario (SDS)6 as a baseline, reflecting the development of a Paris-aligned electricity mix. Both baselines were normalised figures of the expected grid composition during a project’s lifetime.
Overall, this methodological development for calculating the avoided emissions of renewable energy projects is in line with our commitment to best-practice impact reporting, even when upgraded methodologies may, at first glance, shed an unfavourable light on the impact achieved by our investments, such as their potential for climate-change mitigation.
In future, we will consider extending this scenario-based approach to other green project categories.
Please click here to read the full impact report.
Sources
informations importantes.
À l’usage des investisseurs professionnels uniquement
Le présent document a été publié par Lombard Odier Funds (Europe) S.A., société anonyme (SA) de droit luxembourgeois, ayant son siège social sis 291, route d’Arlon, 1150 Luxembourg, agréée et réglementée par la CSSF en tant que Société de gestion au sens de la directive 2009/65/CE, telle que modifiée, et au sens de la directive 2011/61/UE sur les gestionnaires de fonds d’investissement alternatifs (directive GFIA). La Société de gestion a pour objet la création, la promotion, l’administration, la gestion et la commercialisation d’OPCVM luxembourgeois et étrangers, de fonds d’investissement alternatifs (« FIA ») et d’autres fonds réglementés, d’organismes de placement collectif ou d’autres véhicules d’investissement, ainsi que l’offre de services de gestion de portefeuille et de conseil en investissement.
Lombard Odier Investment Managers (« LOIM ») est un nom commercial.
Ce document est fourni à titre d’information uniquement et ne constitue pas une offre ou une recommandation d’acquérir ou de vendre un titre ou un service quelconque. Il n’est pas destiné à être distribué, publié ou utilisé dans une quelconque juridiction où une telle distribution, publication ou utilisation serait illégale. Ce document ne contient pas de recommandations ou de conseils personnalisés et n’est pas destiné à remplacer un quelconque conseil professionnel sur l’investissement dans des produits financiers. Avant de conclure une transaction, l’investisseur doit examiner avec soin si celle-ci est adaptée à sa situation personnelle et, si besoin, obtenir des conseils professionnels indépendants au sujet des risques, ainsi que des conséquences juridiques, réglementaires, financières, fiscales ou comptables. Ce document est la propriété de LOIM et est adressé à son destinataire pour son usage personnel exclusivement. Il ne peut être reproduit (en totalité ou en partie), transmis, modifié ou utilisé dans un autre but sans l’accord écrit préalable de LOIM. Ce document contient les opinions de LOIM, à la date de publication.
Ni ce document ni aucune copie de ce dernier ne peuvent être envoyés, emmenés ou distribués aux États-Unis, dans l’un de leurs territoires, possessions ou zones soumises à leur juridiction, ni à une personne américaine ou dans l’intérêt d’une telle personne. À cet effet, l’expression « Personne américaine » désigne tout citoyen, ressortissant ou résident des États-Unis d’Amérique, toute association organisée ou existant dans tout État, territoire ou possession des États-Unis d’Amérique, toute société organisée en vertu des lois des États-Unis ou d’un État, d’un territoire ou d’une possession des États-Unis, ou toute succession ou trust soumis dont le revenu est imposable aux États-Unis, qu’en soit l’origine.
Source des chiffres : sauf mention contraire, les chiffres sont fournis par LOIM.
Bien que certaines informations aient été obtenues auprès de sources publiques réputées fiables, sans vérification indépendante, nous ne pouvons garantir leur exactitude ni l’exhaustivité de toutes les informations disponibles auprès de sources publiques.
Les avis et opinions sont exprimés à titre indicatif uniquement et ne constituent pas une recommandation de LOIM pour l’achat, la vente ou la détention de quelque titre que ce soit. Les avis et opinions sont donnés en date de cette présentation et sont susceptibles de changer. Ils ne devraient pas être interprétés comme des conseils en investissement.
Aucune partie de ce document ne saurait être (i) copiée, photocopiée ou reproduite sous quelque forme et par quelque moyen que ce soit, ou (ii) distribuée à toute personne autre qu’un employé, cadre, administrateur ou agent autorisé du destinataire sans l’accord préalable de Lombard Odier Funds (Europe) S.A. Au Luxembourg, ce document est utilisé à des fins marketing et a été approuvé par Lombard Odier Funds (Europe) S.A., qui est autorisée et réglementée par la CSSF.
© 2021 Lombard Odier IM. Tous droits réservés.


