investment viewpoints
Climate bonds: assessing avoided emissions


Assessing the carbon profile of projects funded by our Global Climate Bond strategy is crucial to determining the climate mitigation potential of our investments. As carbon is the ‘currency’ of climate change, our independent analysis is aimed at mitigating the lack of harmonisation and different degrees of sophistication characterising issuers’ reporting on avoided greenhouse gas (GHG) emissions.
The Carbon Yield® methodology1 quantifies one of the environmental impacts of the strategy in terms of greenhouse gas (GHG) emissions avoided through financed activities per USD invested. The methodology estimates the difference between:
- The carbon footprint of the funded projects
- The GHG emissions that would have occurred under a reasonable baseline scenario if those projects had not been implemented
Figure 1. The Carbon Yield® method to quantify avoided GHG emissions
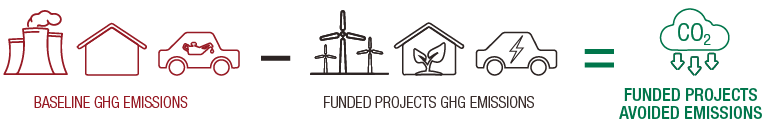
Source: AIM, LOIM. For illustrative purposes only.
The difference represents the emissions that are potentially avoided by a given project2. Individual bond avoided emissions figures are aggregated to determine the portfolio–weighted GHG emissions avoided per unit of capital invested, ie the Carbon Yield®. The results of the funded projects’ GHG analysis in 2020 are summarised in figure 2. Through its 2020 holdings, the strategy avoided 126,622tCO2e due to the projects funded. This equates to a significant 70% GHG emissions savings.
Figure 2. Avoided emissions: 70% GHG emissions savings
|
CARBON YIELD |
⇒
⇒ |
Equivalent to the emissions resulting from the average annual electricity consumption of 300 households in the United Kingdom.
Equivalent to the emissions resulting from over 1 million km driven by an average passenger vehicle in the United States.
|
|
|
This equates to 70% GHG emissions savings. This represents the percentage difference between the footprint of the average baseline project and the footprint of the average funded project. Calculations are based on project-level scope 1 & 2 emissions. |
126,622tCO2 e avoided per year due to the projects funded by the bonds held. Calculations are based on the International Energy Agency’s (IEA’s) Stated Policies Scenario (STEPs). Calculations are based on project-level scope 1 & 2 emissions. |
Scope 1 & 2 |
emissions 53,631 tCO2e Estimated to arise from the operations of the funded projects. |
|
Scope 1, 2 & 3 |
emissions 69,710 tCO2e Estimated to arise when the construction and material use of the funded projects is also accounted for. |
||


Source: AIM, LOIM. For illustrative purposes only.
Renewables: setting dynamic baselines
This year’s Impact Report differs from previous years in setting a dynamic baseline for avoided emissions in the renewables sector. While the change may result in lower estimated GHG emissions savings, it is the result of a more robust and conservative baseline-setting exercise that reflects our commitment to reporting impact using the best practice available.
In previous years, AIM conducted the analysis by assuming a static, business-as-usual scenario that implied the use of a ‘status quo’ baseline over the lifetime of a given funded project. For renewable energy projects in 2020, the decision was made to replace business-as-usual baselines with dynamic baselines that take into consideration future changes in the composition of electricity grids across the globe, and consequent changes in their emission intensity, under rigorous scenarios.
For a renewable energy power-generating asset, avoided emissions are represented by the GHG emissions savings that are potentially enabled by the substitution of grid electricity (baseline scenario) with electricity from renewable sources generated through the funded project.
The generation mix of electricity grids across the globe has changed considerably in recent years. Figure 3 shows the recent development of grid emission factors in the United States and the European Union as well as future estimated emission factors derived from IEA projections under different scenarios as defined in the 2020 World Energy Outlook (WEO)3. Both grids, to different extents, have undergone substantial decarbonisation paths. This global trend is then projected to be reinforced by the increased ambition of climate policies, technology progress and market development that will lead to a larger uptake of renewables and lesser reliance on fossil fuels.
Figure 3. Carbon intensity of the electricity grid in the US and EU
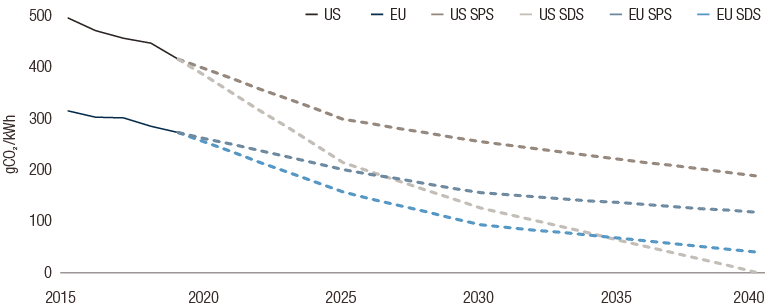
Source: LOIM, AIM elaboration based on EIA and EEA (historical data) and IEA 2020 WEO (future projections). For illustrative purposes only.4
In light of the above, AIM deemed that static, business-as-usual baselines—i.e. point-in-time grid emission factors—should be replaced with emission factors reflecting the expected evolution of the energy mix during a given project’s lifetime.
For 2020, the dynamic baselines were based on the IEA’s Stated Policies Scenario (STEPS)5. The STEPS scenario "reflects the impact of existing policy frameworks and today’s announced policy intentions". In addition, the same analysis was undertaken using the IEA’s Sustainable Development Scenario (SDS)6 as a baseline, reflecting the development of a Paris-aligned electricity mix. Both baselines were normalised figures of the expected grid composition during a project’s lifetime.
Overall, this methodological development for calculating the avoided emissions of renewable energy projects is in line with our commitment to best-practice impact reporting, even when upgraded methodologies may, at first glance, shed an unfavourable light on the impact achieved by our investments, such as their potential for climate-change mitigation.
In future, we will consider extending this scenario-based approach to other green project categories.
Please click here to read the full impact report.
Sources
important information.
For professional investor use only
This document has been issued by Lombard Odier Funds (Europe) S.A. a Luxembourg based public limited company (SA), having its registered office at 291, route d’Arlon, 1150 Luxembourg, authorised and regulated by the CSSF as a Management Company within the meaning of EU Directive 2009/65/EC, as amended; and within the meaning of the EU Directive 2011/61/EU on Alternative Investment Fund Managers (AIFMD). The purpose of the Management Company is the creation, promotion, administration, management and the marketing of Luxembourg and foreign UCITS, alternative investment funds ("AIFs") and other regulated funds, collective investment vehicles or other investment vehicles, as well as the offering of portfolio management and investment advisory services.
Lombard Odier Investment Managers (“LOIM”) is a trade name.
This document is provided for information purposes only and does not constitute an offer or a recommendation to purchase or sell any security or service. It is not intended for distribution, publication, or use in any jurisdiction where such distribution, publication, or use would be unlawful. This material does not contain personalized recommendations or advice and is not intended to substitute any professional advice on investment in financial products. Before entering into any transaction, an investor should consider carefully the suitability of a transaction to his/her particular circumstances and, where necessary, obtain independent professional advice in respect of risks, as well as any legal, regulatory, credit, tax, and accounting consequences. This document is the property of LOIM and is addressed to its recipient exclusively for their personal use. It may not be reproduced (in whole or in part), transmitted, modified, or used for any other purpose without the prior written permission of LOIM. This material contains the opinions of LOIM, as at the date of issue.
Neither this document nor any copy thereof may be sent, taken into, or distributed in the United States of America, any of its territories or possessions or areas subject to its jurisdiction, or to or for the benefit of a United States Person. For this purpose, the term "United States Person" shall mean any citizen, national or resident of the United States of America, partnership organized or existing in any state, territory or possession of the United States of America, a corporation organized under the laws of the United States or of any state, territory or possession thereof, or any estate or trust that is subject to United States Federal income tax regardless of the source of its income.
Source of the figures: Unless otherwise stated, figures are prepared by LOIM.
Although certain information has been obtained from public sources believed to be reliable, without independent verification, we cannot guarantee its accuracy or the completeness of all information available from public sources.
Views and opinions expressed are for informational purposes only and do not constitute a recommendation by LOIM to buy, sell or hold any security. Views and opinions are current as of the date of this presentation and may be subject to change. They should not be construed as investment advice.
No part of this material may be (i) copied, photocopied or duplicated in any form, by any means, or (ii) distributed to any person that is not an employee, officer, director, or authorised agent of the recipient, without Lombard Odier Funds (Europe) S.A prior consent. In Luxembourg, this material is a marketing material and has been approved by Lombard Odier Funds (Europe) S.A. which is authorized and regulated by the CSSF.
©2021 Lombard Odier IM. All rights reserved.


