multi-asset
When can we look beyond the recession?


In the latest instalment of Simply put, where we make macro calls with a multi-asset perspective, we look to history to try to gauge when we can start preparing for a post-recession rebound.
|
Need to know
|
|---|
We know the drill
Most recessions in post-Bretton Woods history have followed monetary tightening that was a response to either inflation (1979, 1988, 1994), or a real estate or financial bubble (2001, 2008). A country’s central bank – often the Federal Reserve – raised rates, and then credit dried up and unemployment rose.
While higher unemployment can initially protect corporate margins and market values, waves of job cuts eventually weigh on aggregate demand, leading to lower earnings and dividends. This situation can hurt share prices – we have all probably seen a graph showing the correlation between earnings contraction and share price decline. However, the pain is usually temporary.
From a portfolio management perspective, a recession is obviously a critical time. However, there comes a point when the manager must be allowed to look toward the other end of the tunnel. The most recent examples of such points were the first quarter of 2009 and April 2020. These were moments when the global economy was approaching the end of the contraction, but what lessons can be derived from history?
At what point should we allow ourselves to position portfolios for the post-recession period?
Of data and recessions
Before we can answer this question, we need to take stock of the available data. We will focus on recessions in the US, for three key reasons. First, there is the quality of the existing dating methodology from the National Bureau of Economic Research (NBER). Few countries have had an official dating committee for so long. We will look at the period of 1950 to 2023, for which the NBER has identified 14 recessions of varying lengths. Secondly, the US cycle is historically synchronised with the global cycle, while the emerging world is generally marginally ahead and Europe marginally behind. Asset prices are probably most affected by global cycles and less by issues specific to certain regions. Finally, we will use predominantly dollar-denominated assets as our measure.
The second key element is to choose a wide range of asset classes to try to capture commonalities. Our analysis is based on equities (here the S&P 500 for the depth of its history), but also 10-year US rates, BBB credit spreads on US bonds, energy prices (since 1971), the dollar (in an effective exchange rate) and the price of gold (also since 1971). This range covers assets that benefit from growth (and suffer from its absence), as well as stocks that can potentially offer safety during difficult market periods. Let's look at the performance of these different markets through the lens of historical averages.
Figure 1: Cumulative average performance per asset since the start of a recession (US data, 1950-2023)
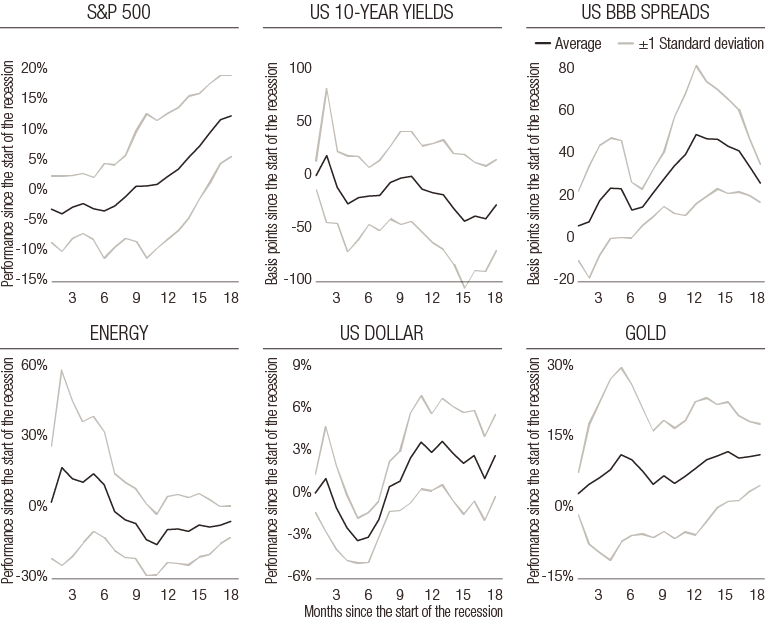
Source : Bloomberg, LOIM
A game of historical averages
Figure 1 shows the average cumulative performance since the beginning of each US recession. The graphs read as follows: during the first nine months of a recession, the performance of US equities is 0% overall. Around this point, an interval constructed by one standard deviation extends from -9% to +9%. Analysing the charts in figure 1 leads us to the following conclusions:
-
Historically, stocks start to rebound nine months after the start of a recession. It will take 15 months for the entire confidence interval to turn positive – investor patience has historically been severely tested
-
10-year rates fall over the entire 18 months analysed here, in two waves: an initial drop in the first four months, then another one that extends to the 15th month. Historically, the duration risk premium is the one to hold during a recession
-
However, the bond world is less consistent in the reaction of its component assets: BBB credit spreads tend to diverge until the 15th month after the start of the recession, and then they stabilise. However, this does not mean that the performance of the credit world remains negative over the entire period, as the asset class's carry increases to compensate for the spread widening
-
Energy prices collapse after the first month by around 30% on average over a year, with the slump in global demand weighing particularly on oil. Stabilisation only occurs from the 11th month onward
-
Gold has historically benefited from recessions, but the bulk of its average performance is accumulated during the first five months, with an average performance of around 10%
-
Finally, the dollar historically loses 5% in the first four months of a recession and then gains around 8%. It is not necessarily the safe asset one might expect
These figures are only averages. Each recession comes with its own particularities, so these results must be treated with caution. However, they can help to shed light on the big question of when we should start to reposition our portfolios.
The answer seems to be somewhere between 9 and 15 months. If there is a soft landing, perhaps this horizon can be shortened by a few months, and the confidence intervals reveal this diversity of situations.
Not all recessions are the same, and the approaching one may well be less severe than expected – at least that is the current message from our nowcasting indicators. The collapse of the credit channel may well worsen things, but the full extent of its impact remains unclear.
| Simply put, the past teaches us that a recession is not a trivial event from a portfolio management perspective. Historically, it takes a year to start positioning your allocations more aggressively again. Will this time be different? |
Macro/nowcasting corner
The most recent evolution of our proprietary nowcasting indicators for global growth, global inflation surprises and global monetary policy surprises designed to track the recent progression of macroeconomic factors driving the markets.
Our nowcasting indicators currently show:
- The decline in US growth drivers continues, with our growth nowcaster settling at 28%: odds of a ‘normal’ landing in the US are increasing
- All three zones we monitor (US, Eurozone and China) are seeing their inflation nowcaster fluctuate around 25%, a clear hint that upcoming inflation pressures are set to decline
- After the Fed and European Central Bank meetings, the global message is getting increasingly clearer: monetary policy is not yet ready to pivot, but aggressive and surprise hikes are over now
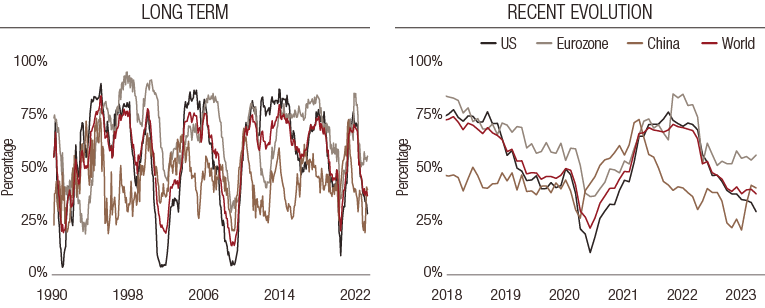
World growth nowcaster: long-term (left) and recent evolution (right)
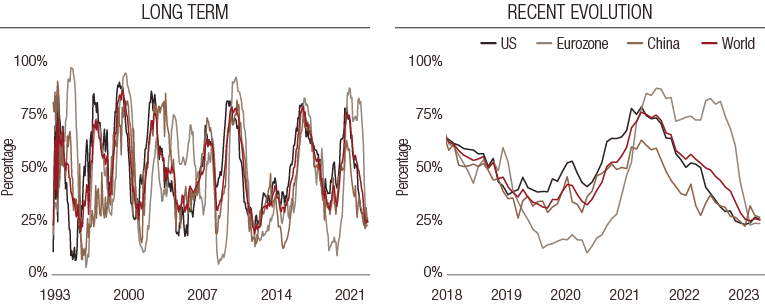
World inflation nowcaster: long-term (left) and recent evolution (right)
World monetary policy nowcaster: long-term (left) and recent evolution (right)
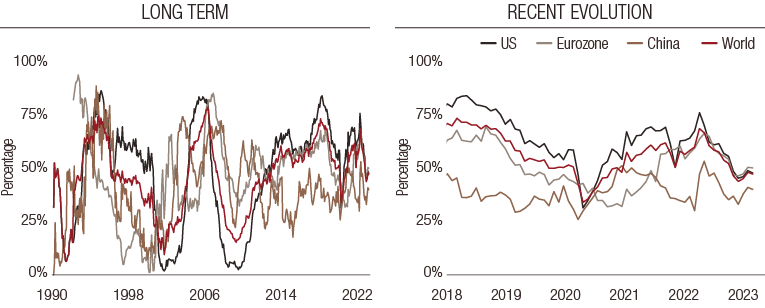
Reading note: LOIM's nowcasting indicators gather economic indicators in a point-in-time fashion to measure the probability of a given macroeconomic risk - growth, inflation and monetary policy surprises. The Nowcaster ranges from 0% (low growth, low inflation and dovish monetary policy) to 100% (high growth, high inflation and hawkish monetary policy).
important information.
FOR PROFESSIONAL INVESTORS ONLY
This document is issued by Lombard Odier Asset Management (Europe) Limited, authorised and regulated by the Financial Conduct Authority (the “FCA”), and entered on the FCA register with registration number 515393.
Lombard Odier Investment Managers (“LOIM”) is a trade name.
This document is provided for information purposes only and does not constitute an offer or a recommendation to purchase or sell any security or service. It is not intended for distribution, publication, or use in any jurisdiction where such distribution, publication, or use would be unlawful. This material does not contain personalized recommendations or advice and is not intended to substitute any professional advice on investment in financial products. Before entering into any transaction, an investor should consider carefully the suitability of a transaction to his/her particular circumstances and, where necessary, obtain independent professional advice in respect of risks, as well as any legal, regulatory, credit, tax, and accounting consequences. This document is the property of LOIM and is addressed to its recipient exclusively for their personal use. It may not be reproduced (in whole or in part), transmitted, modified, or used for any other purpose without the prior written permission of LOIM. This material contains the opinions of LOIM, as at the date of issue.
Neither this document nor any copy thereof may be sent, taken into, or distributed in the United States of America, any of its territories or possessions or areas subject to its jurisdiction, or to or for the benefit of a United States Person. For this purpose, the term "United States Person" shall mean any citizen, national or resident of the United States of America, partnership organized or existing in any state, territory or possession of the United States of America, a corporation organized under the laws of the United States or of any state, territory or possession thereof, or any estate or trust that is subject to United States Federal income tax regardless of the source of its income.
Source of the figures: Unless otherwise stated, figures are prepared by LOIM.
Although certain information has been obtained from public sources believed to be reliable, without independent verification, we cannot guarantee its accuracy or the completeness of all information available from public sources.
Views and opinions expressed are for informational purposes only and do not constitute a recommendation by LOIM to buy, sell or hold any security. Views and opinions are current as of the date of this presentation and may be subject to change. They should not be construed as investment advice.
No part of this material may be (i) copied, photocopied or duplicated in any form, by any means, or (ii) distributed to any person that is not an employee, officer, director, or authorised agent of the recipient, without Lombard Odier Asset Management (Europe) Limited prior consent. In the United Kingdom, this material is a marketing material and has been approved by Lombard Odier Asset Management (Europe) Limited which is authorized and regulated by the FCA. ©2023 Lombard Odier IM. All rights reserved.

