global perspectives
Good news is good news, but for how long?


In the latest instalment of Simply put, we consider why good economic news can sometimes lead to poor market performance during a monetary tightening cycle and whether the current cycle may be nearing this point.
|
Need to know:
|
|---|
Over the past two weeks, markets have stabilised and then started to rise by a couple of percentage points as investors began to trim their recession bets. Macro data remain strong both in the US and in Europe, explaining why the extreme investor pessimism is losing some ground. A worldwide recession is probably not going to happen tomorrow and the current growth cycle is not dead yet. Today’s inflation is deeply rooted in the strength of the current growth cycle. This means – as with any late monetary cycle period – the solid economic data that are still being published should be a catalyst for both the Federal Reserve (Fed) and the European Central Bank (ECB) to toughen up their measures against inflation. At some point, good macro news will start to be seen as bad news for markets by investors: the longer we see this strong macro backdrop, the more monetary authorities will feel the urge to slow economic activity down. So when will we reach that point? When will good news become bad news?
In order to answer this question, we first need to create an indicator which can measure this phenomenon. Good-news-is-good-news means that equity markets rise on the back of positive economic surprises. This typically happens during recovery periods, as market pessimism is challenged by good macro news, lifting markets. The opposite has also happened in the past: negative economic surprises have led to markets rising on the back of expected monetary policy stimulation. A natural way to measure such a “macro-to-market” reaction function is to run a rolling regression of equity returns against a surprise index. There are a handful of potential candidates for the surprise index component but the most well-known is the Citi Economic Surprise Index. Chart 1 shows the outcome of a three-month rolling regression of MSCI World returns versus this surprise index. Once the data are smoothed by using a moving average, a message starts to become clear and highlights two types of periods:
- “Good-news-is-good-news”: This has typically been the case during growth periods (2010-2014) and at the start of recessions (i.e. 2008). In both cases good economic news has prompted positive equity performance, while bad economic news led to negative equity performance (this scenario can also be called “bad-news-is-bad-news”).
- “Good-news-is-bad-news”: Our analysis covers a mix of situations. Periods, such as 2007, 2016, 2018, the late part of 2019, were mostly times when monetary policy stopped being particularly accommodative. When macro conditions warrant central banks to start becoming hawkish, markets increasingly start to perceive that good economic conditions today will mean deteriorating economic conditions tomorrow, as central banks are forced take measures to slow down the economy.
Chart 1. Good-news-is-good-news indicator evolution 2006-2022
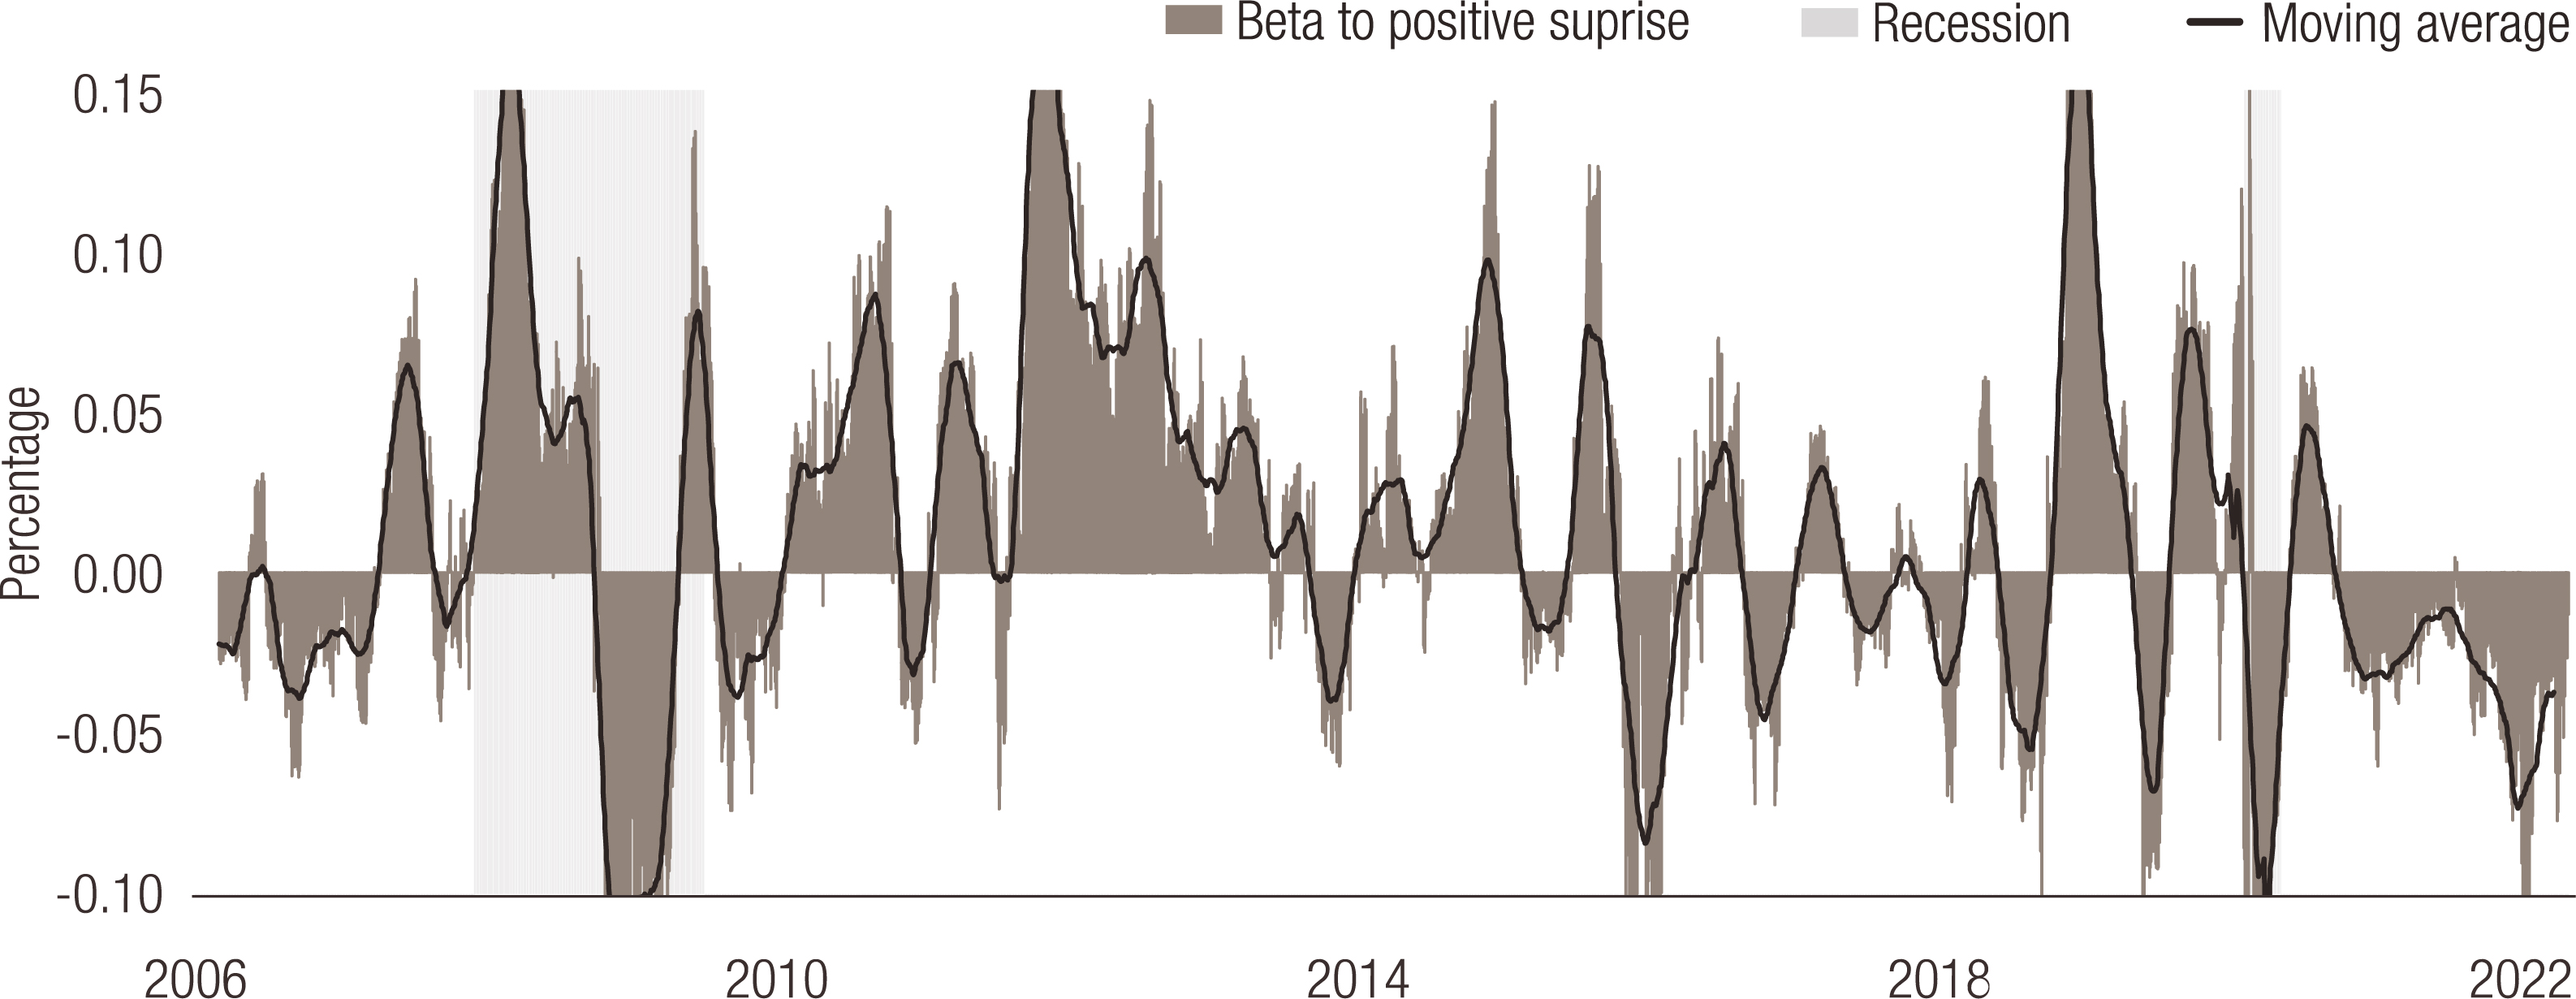
Source: Bloomberg, LOIM
This connection to periods of policy hikes may seem intuitive but we believe chart 1’s outcome calls for more precise analysis. Chart 2, therefore, shows the average beta of equity returns versus macro surprises at the point when the Fed has first started a round of hikes, as calculated over the 2006-2022 period. The chart shows that:
• Prior to the first hike, and up to four months after it, markets tend to remain in a “good-news-is-good-news” pattern.
• Four month after the first hike, the beta changes, highlighting a market shift to a “good-news-is-bad-news” mind set.
Chart 2. Average evolution of the “good-news-is-good-news” indicator around the timing of the Fed’s first rate hike (2006-2022)

Source: Bloomberg, LOIM
Reading note: the chart shows the historical evolution of the beta of the MSCI World Equities’ returns to the Citi Surprise Index. A positive reading indicates that positive macro surprises lead to higher equity prices (“good-news-is-good-news”), whereas negative readings are indicative that “good-news-is-bad-news”.
The chart also highlights that today, it has been four months since the Fed’s first rate hike. Looking back to chart 1, it is clear that the signal recently turned slightly negative. It may be too early to call, but given the time that has elapsed since the Fed’s first hike and this initial change of direction of the beta, we believe the period when good news has stopped being good news for markets may have been reached. Given the ongoing high levels of growth shown by our growth nowcaster (suggesting a slowdown is only just commencing) and the high level of our monetary policy nowcaster (meaning central banks could continue to surprise us with their hawkish policy), it could be that the next stream of good news weighs on markets rather than lifting them up. It is probably too early to definitively declare the start of such a period, but we believe increased vigilance to this established market pattern is warranted from now on.
Simply put, good macro conditions lead to tougher central banks so investors should watch out for a return of the “good-news-is-bad-news” phenomenon.
Macro/Nowcasting Corner
The most recent evolution of our proprietary nowcasting indicators for world growth, world inflation surprises and world monetary policy surprises are designed to keep track of the latest macro drivers making markets tick. Along with it, we wrap up the macro news of the week.
Economic data this week have been a strong remainder of a harsh truth: the US economy is actually doing very well, thank you. Unlike previous weeks, most of the data point in the same direction: growth during Q2 should remain strong and we are likely to be surprised to the upside rather than to the downside. The US ISM rose to 56.1 in May, from 55.4 the month before. More importantly, its new orders component increased from 53.5 to 55.1, beating expectations of 52.9. Economists keep being surprised to the upside, again raising the question of whether further monetary policy hawkishness is required to counter this very strong growth. Unit labour costs are now almost on par with the 1970-1980 period, which will probably push markets towards a good (macro) news is bad (market) news mindset pretty soon. These costs have progressed by 12.6% over Q1 in annualised terms: a number that compares well to Q1 1977 (+12.7%) or Q1 1979 (+14.8%). This is unlikely to remain unnoticed by chairman Powell and should impact the conduct of US monetary policy. Fed consumer credit data are going through the roof as well, showing a growth rate of 52 billion net monthly change, the strongest progression since 1904 in nominal terms. In GDP terms it remains impressive, but is in line with the highs of past time series. Consumer surveys remain at low levels but showed a tepid improvement this week (see the Conference Board data). The only bad news is the Employment component of the ISM survey which showed a decline from 50.9 to 49.6 (expected at 52). For now, our nowcasting indicators still show a positive overall message and the jobs report on Friday did not contradict that assessment.
In the Eurozone, inflation has hit the headlines once more: core inflation has moved from a year-over-year increase of 7.5% to 8.1% in May, while core inflation changed from 3.5% to 3.8%. Both numbers are higher than expectations – in line with the message from our nowcasters – and show how “surprisingly higher European inflation” should remain a core story for the coming months. This paves the way for a much more hawkish ECB in June – raising the case for higher short-term rates in Europe. PPI inflation has now reached 37.2% in year-over-year terms, but was actually below expectations (38.2%). The message remains consistent: inflation in Europe is rising, first for supply reasons, but it is now increasingly following the path of the US, with much more demand-driven and structural inflation. The European Commission surveys continue to highlight the growth situation remaining good in Europe: most of the components in this survey may be declining but they remain far from recessionary levels. This information will make the job of the ECB more complicated than that of the Fed, as the economic situation is already slowing down.
Chinese data showed the first positive signs in a long time. Most of these can be attributed to the reopening of the economy after the surge in Covid cases – but the recent set of stimulation has also opened the door to an improvement in coming months. The PMI surveys published during the week were all higher – but the coincidence between the readings for both of the service and manufacturing indices shows how dependent this improvement is on the reopening. Our nowcasting signal continues to flash red for now.
Factoring in these new data points, our nowcasting indicators currently point to:
- Worldwide growth remaining solid. The US and Eurozone still show high numbers, but these are now clearly declining in the Eurozone. However, growth remains solid in both areas.
- Inflation surprises should remain positive, but signals have shown a recent decline. In the US, this has brought the indicator increasingly close to the 50% line. Only European inflation looks set to keep on surprising to the upside.
- Monetary policy is set to remain on the hawkish side, mirroring the strength of economic activity. The European Central Bank should be flexing its tightening muscles next.
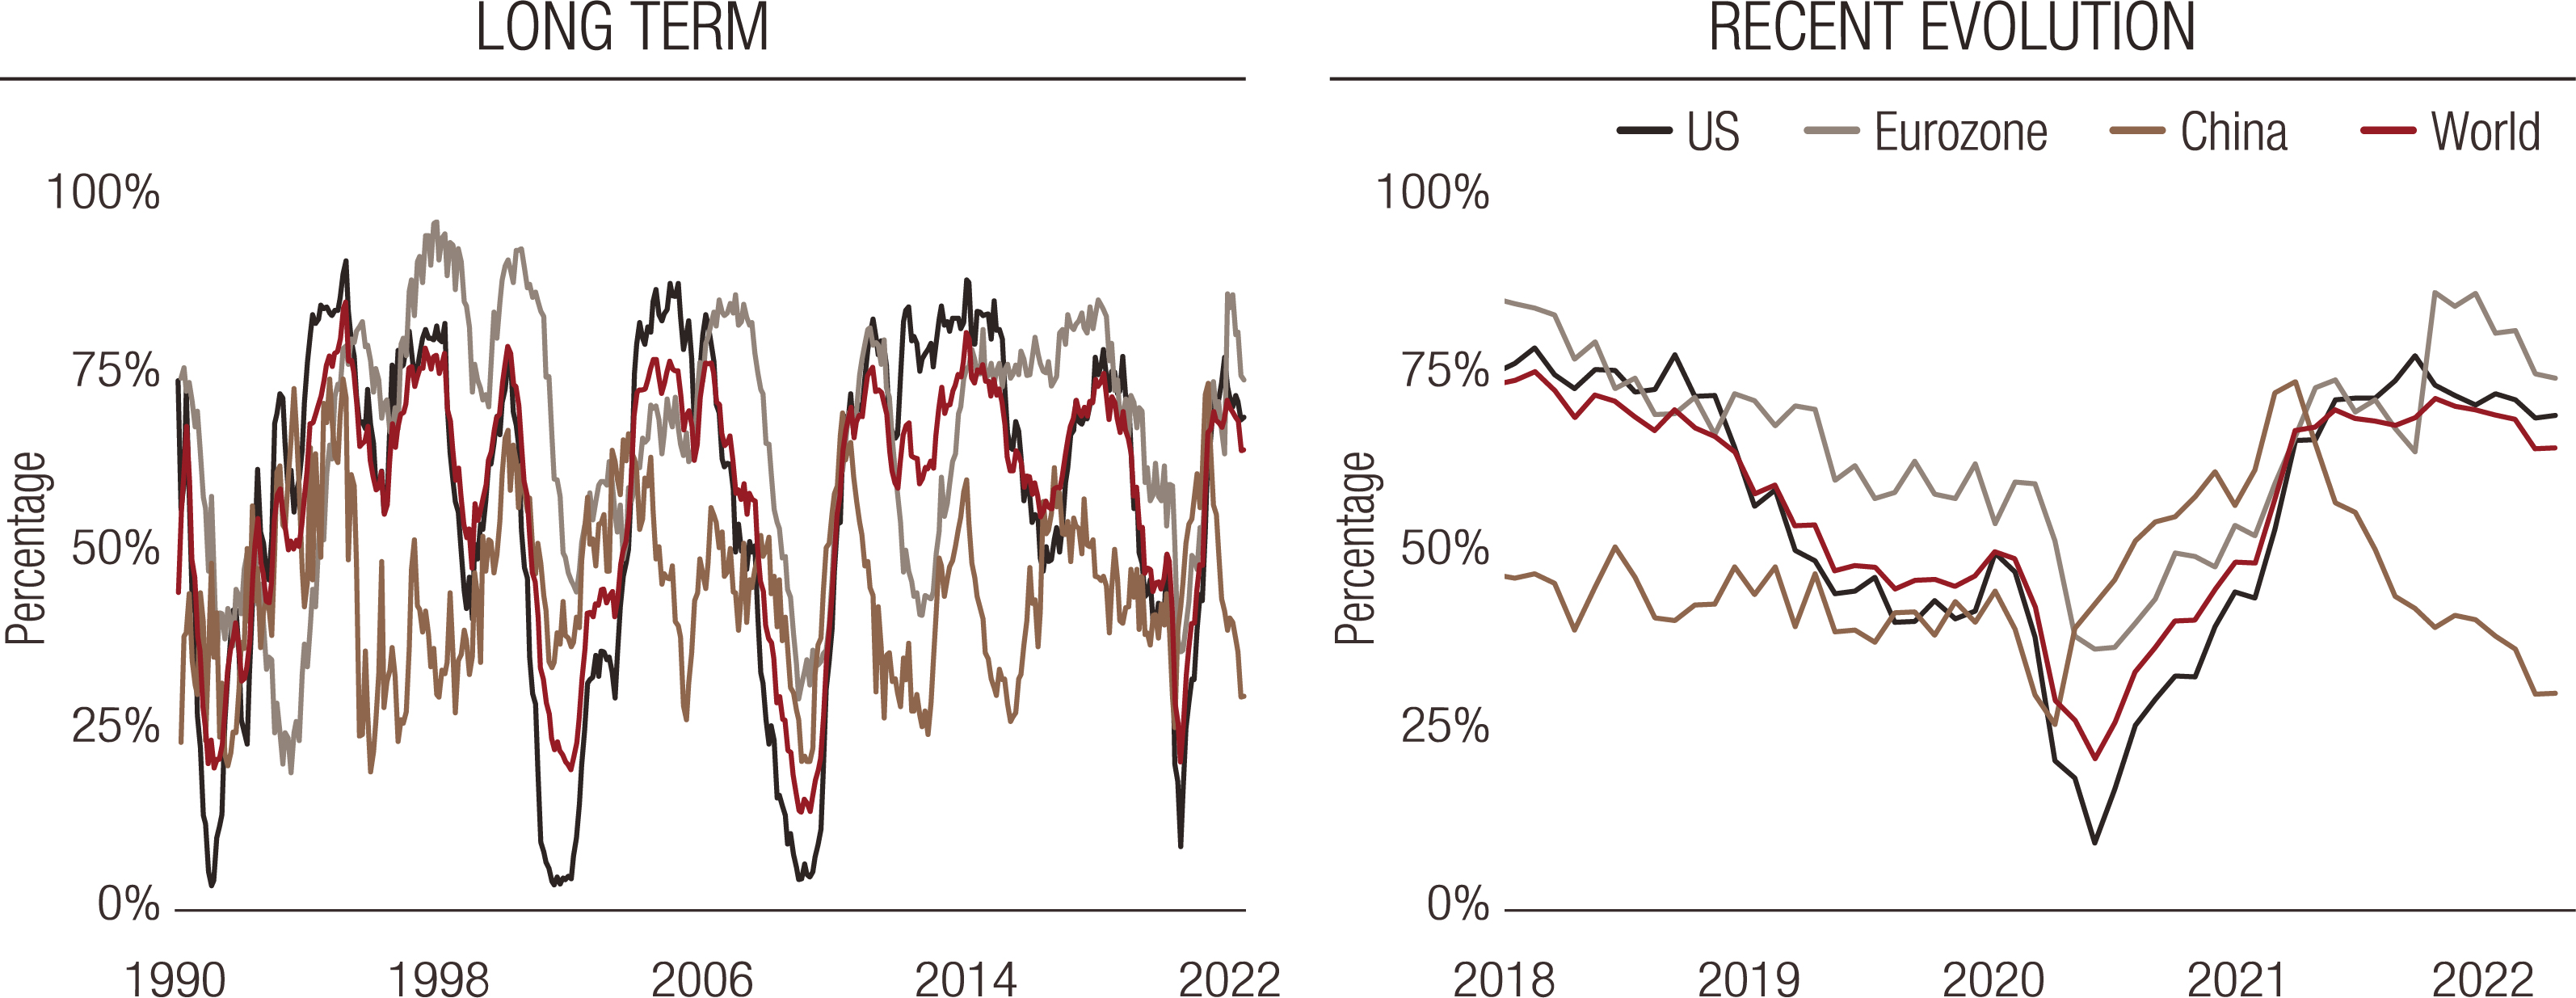
World Growth Nowcaster: Long-Term (left) and Recent Evolution (right)
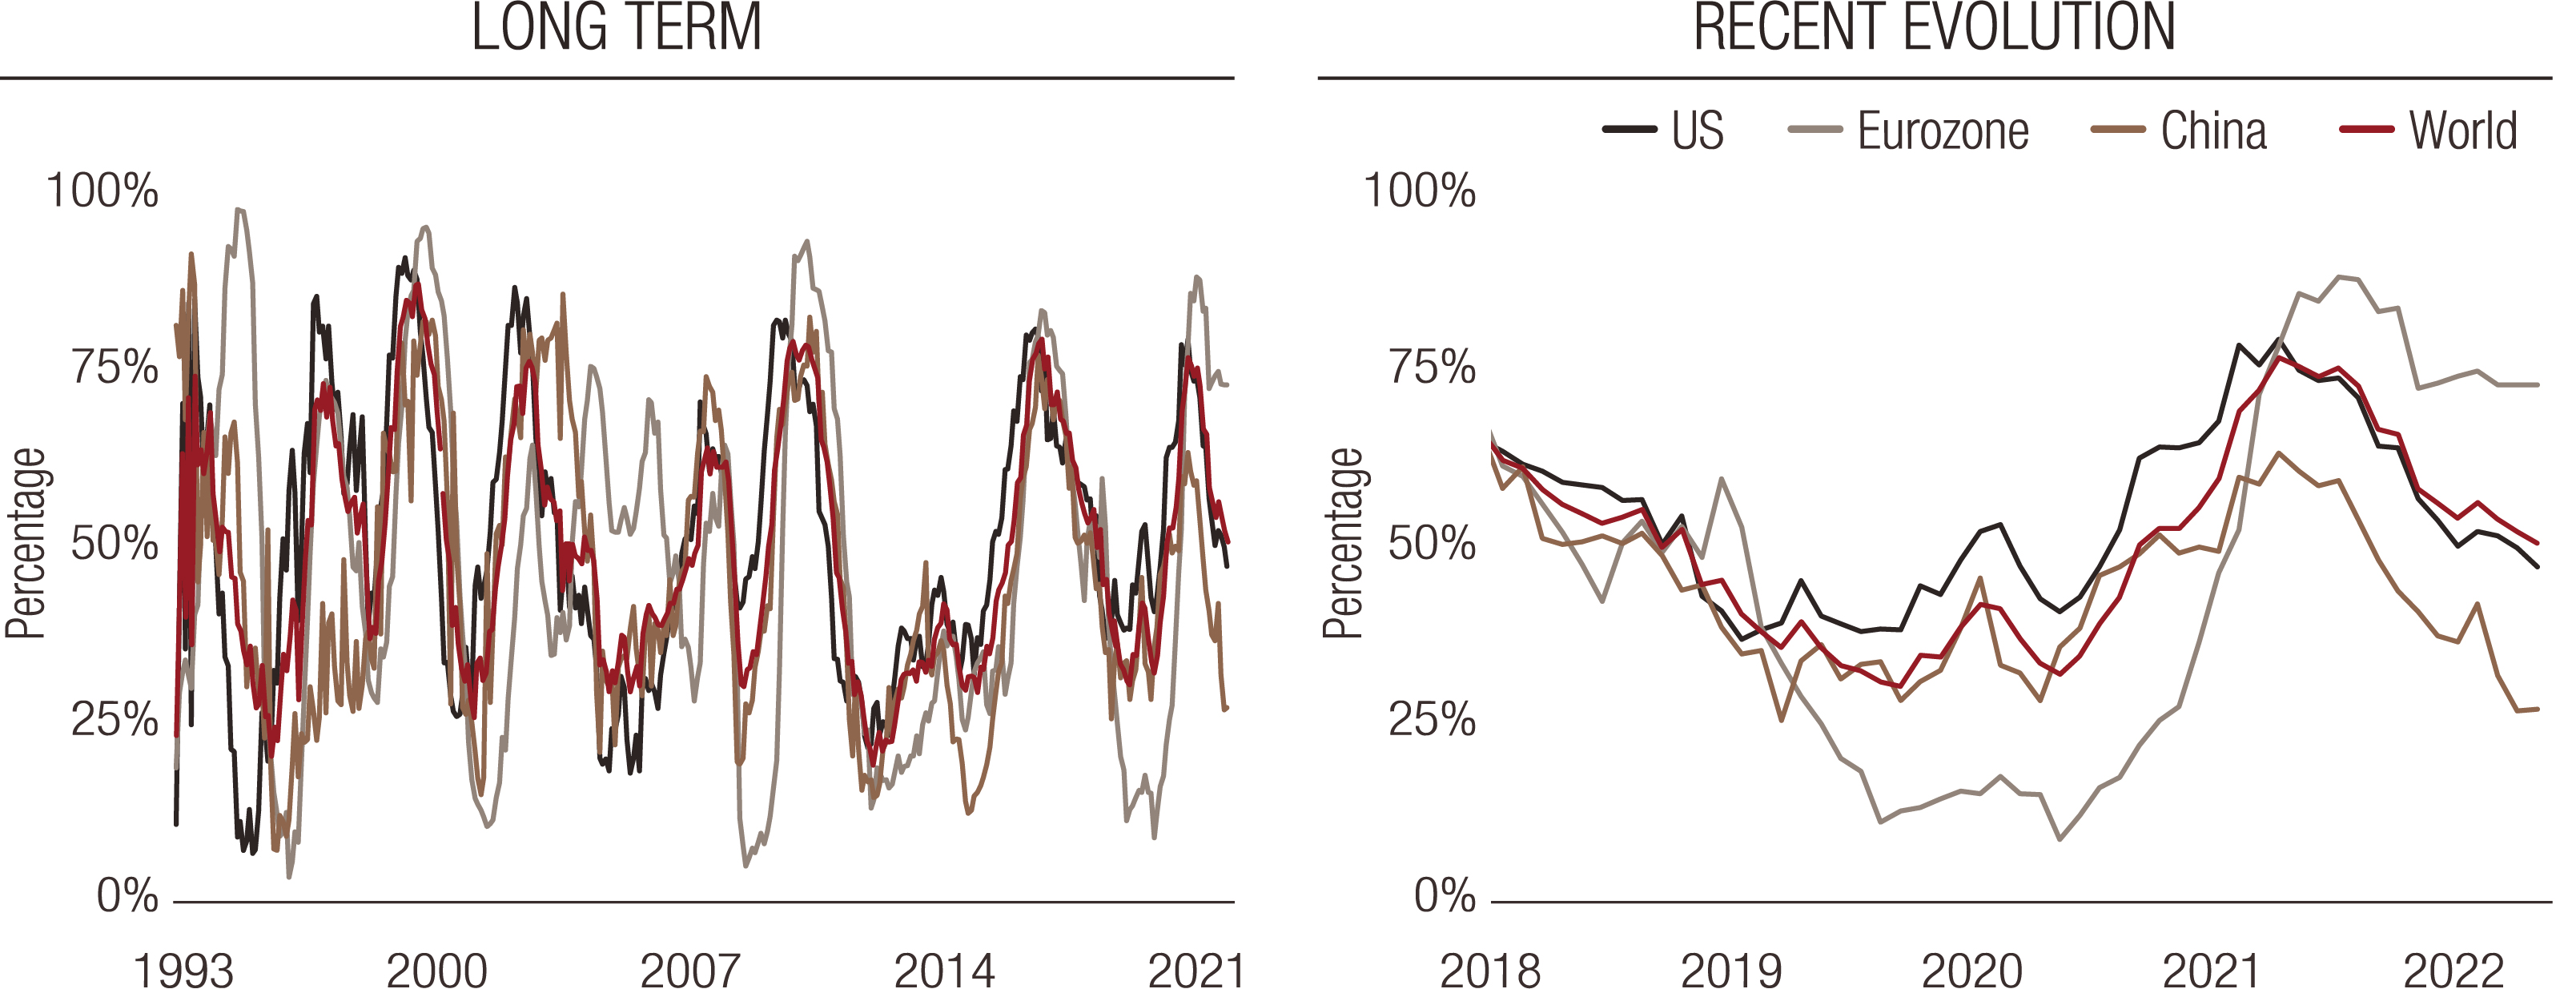
World Inflation Nowcaster: Long-Term (left) and Recent Evolution (right)
World Monetary Policy Nowcaster: Long-Term (left) and Recent Evolution (right)
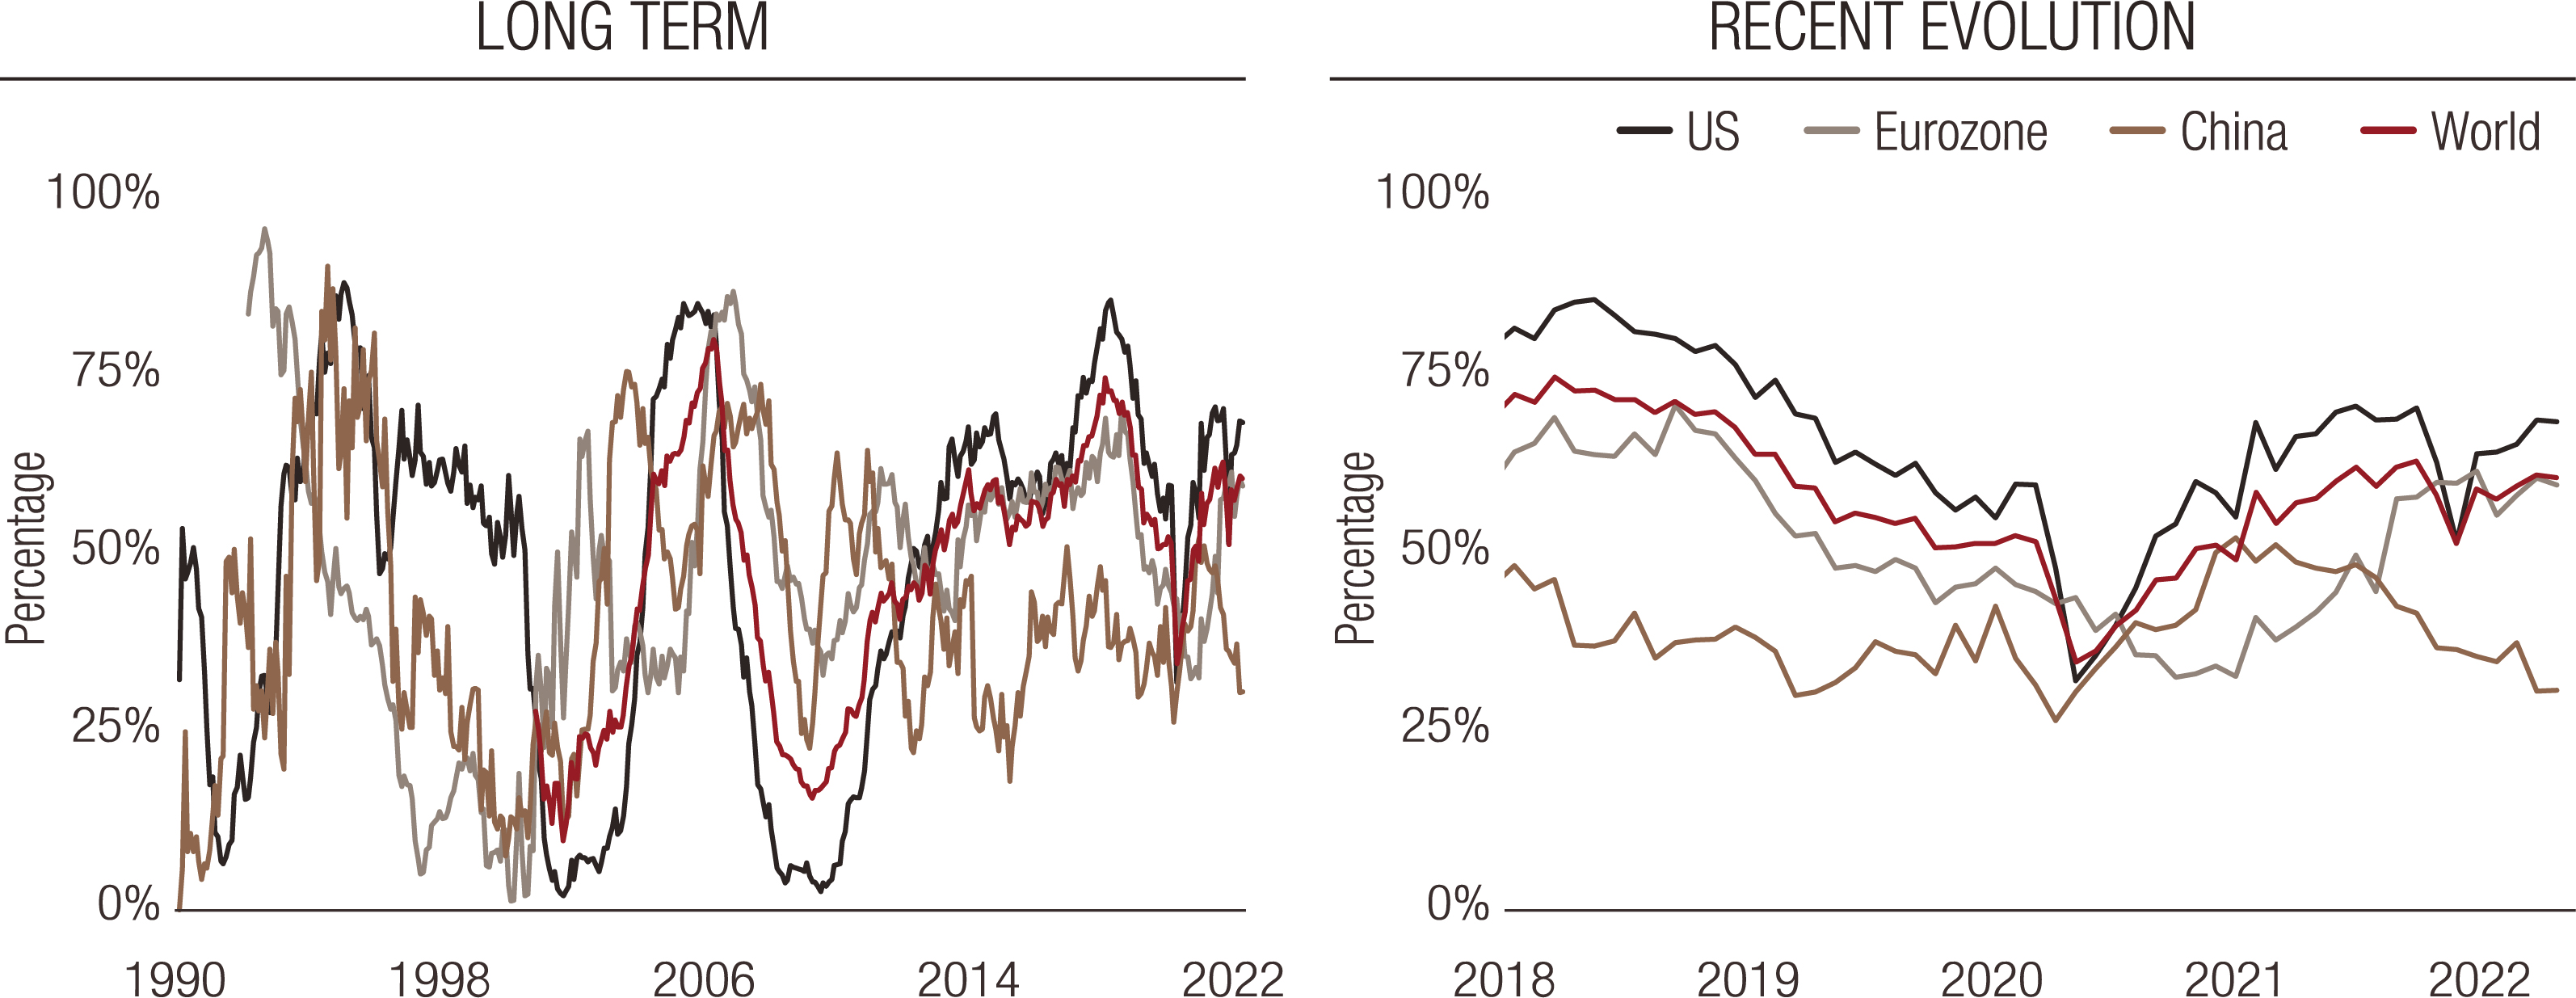
Reading note: LOIM’s nowcasting indicator gather economic indicators in a point-in-time manner in order to measure the likelihood of a given macro risk – growth, inflation surprises and monetary policy surprises. The Nowcaster varies between 0% (low growth, low inflation surprises and dovish monetary policy) and 100% (the high growth, high inflation surprises and hawkish monetary policy).
important information.
For professional investor use only.
This document is issued by Lombard Odier Asset Management (Europe) Limited, authorised and regulated by the Financial Conduct Authority (the “FCA”), and entered on the FCA register with registration number 515393.
Lombard Odier Investment Managers (“LOIM”) is a trade name. This document is provided for information purposes only and does not constitute an offer or a recommendation to purchase or sell any security or service. It is not intended for distribution, publication, or use in any jurisdiction where such distribution, publication, or use would be unlawful. This material does not contain personalized recommendations or advice and is not intended to substitute any professional advice on investment in financial products. Before entering into any transaction, an investor should consider carefully the suitability of a transaction to his/her particular circumstances and, where necessary, obtain independent professional advice in respect of risks, as well as any legal, regulatory, credit, tax, and accounting consequences. This document is the property of LOIM and is addressed to its recipient exclusively for their personal use. It may not be reproduced (in whole or in part), transmitted, modified, or used for any other purpose without the prior written permission of LOIM. This material contains the opinions of LOIM, as at the date of issue.
Any benchmarks/indices cited herein are provided for information purposes only. No benchmark/index is directly comparable to the investment objectives, strategy or universe of a fund. The performance of a benchmark shall not be indicative of past or future performance of any fund. It should not be assumed that the relevant fund will invest in any specific securities that comprise any index, nor should it be understood to mean that there is a correlation between such fund’s returns and any index returns.
Neither this document nor any copy thereof may be sent, taken into, or distributed in the United States of America, any of its territories or possessions or areas subject to its jurisdiction, or to or for the benefit of a United States Person. For this purpose, the term “United States Person” shall mean any citizen, national or resident of the United States of America, partnership organized or existing in any state, territory or possession of the United States of America, a corporation organized under the laws of the United States or of any state, territory or possession thereof, or any estate or trust that is subject to United States Federal income tax regardless of the source of its income.
Source of the figures: Unless otherwise stated, figures are prepared by LOIM.
Although certain information has been obtained from public sources believed to be reliable, without independent verification, we cannot guarantee its accuracy or the completeness of all information available from public sources. Views and opinions expressed are for informational purposes only and do not constitute a recommendation by LOIM to buy, sell or hold any security. Views and opinions are current as of the date of this presentation and may be subject to change. They should not be construed as investment advice.
No part of this material may be (i) copied, photocopied or duplicated in any form, by any means, or (ii) distributed to any person that is not an employee, officer, director, or authorised agent of the recipient, without Lombard Odier Asset Management (Europe) Limited prior consent. In the United Kingdom, this material is a marketing material and has been approved by Lombard Odier Asset Management (Europe) Limited which is authorized and regulated by the FCA.
©2022 Lombard Odier IM. All rights reserved.


